- Title: The Hα Variations of the Luminous Blue Variable P Cygni: Discrete Absorption Components and the Short S Doradus Phase
- Authors: N. D. Richardson, N. D. Morrison, D. R. Gies, N. Markova, E. N. Hesselbach, and J. R. Percy
- Institution of First Author: Center for High Angular Resolution Astronomy, Department of Physics and Astronomy, Georgia State University.
Variable Stars
Not all stars are as well-behaved as our Sun. Some reprobate massive stars (greater than several solar masses) can flare, outflow, and even eject a significant amount of their material into the interstellar medium. Variable stars like Luminous Blue Variables (LBVs), Cepheid variables, RR Lyrae variables and cataclysmic variables like novae, accreting neutron stars, and Type Ia supernovae have proved deeply interesting objects to study, for several reasons. The period of variability of some stars, like Cepheids and RR Lyrae-like stars, is correlated with their intrinsic brightness, making them excellent standard candles for use in distance measurements. Cataclysmic variable stars represent possible end-states of stellar evolution, and in the case of Type Ia supernovae, the synthesis of heavier elements for use in the formation future stars and planets.
In their paper on the arXiv, the authors study variations of a particular spectral line of the famous Luminous Blue Variable, P Cygni. This massive star was first discovered in 1600 when it suddenly brightened to 3rd magnitude (in a dark sky, one can typically only see as faint as 5th magnitude with the naked eye), and then several years later faded from sight. Currently, it is just barely visible to the naked eye at 4.8 magnitude. In my previous post, I mentioned that spectroscopic observations of astronomical targets can reveal a great deal of information about an object unobtainable through imaging alone. The authors analyzed the spectra of P Cygni to obtain information about the velocity of the outflowing stellar wind, the size of the photosphere, and the mass loss rate of the star.
Spectral Lines
The emission from atomic transitions between energy levels is manifest as spectral lines, which are observable by a spectrograph. By far, the most abundant element in the universe (and in most stars) is hydrogen, and therefore observations of atomic transitions of hydrogen are very important for astronomers. From intro physics, one may remember that the transition of a hydrogen atom’s electron from an excited state (such as n=2, n=3, etc…) to the n=1 state results in the Lyman series of spectral lines, and that a transition from an excited state (such as n=3, n=4, etc…) to the n=2 results in the Balmer series of spectral lines. Because the frequency of the Balmer series of spectral lines are in the range of optical frequencies that humans can observe with the naked eye, they are traditional to astronomy. Astronomers have developed colloquial names for each transition: the Balmer n=3 to n=2 transition is called Hα, the Balmer n=4 to n=2 transition is called Hβ, the Balmer n=5 to n=2 is called Hγ, and so on throughout the Greek alphabet. The Lyman transitions are typically referred to as Lyα (n=2 to n=1), Lyβ (n=3 to n=1) and so on. The Lyman transitions result in spectral lines in the ultraviolet (higher frequency than optical), and therefore can usually only be studied via space-telescopes such as the Hubble Space Telescope or GALEX, since the Earth’s atmosphere blocks UV light (most of the time).
Doppler Shift
As the wailing siren of a police car passes an observer, the observed frequency of the sound changes. When it travels towards the observer, it is high-pitched; once it passes the observer and starts traveling away, it changes to a lower pitch. This phenomenon is called the Doppler shift. Much like sound, light can also be Doppler shifted, although for the effect to be detectable usually requires relative speeds only obtainable in astronomical scenarios (velocities of ~1 kilometer per second or larger).
The Doppler shift of light is governed by the following equation: 

The generation of spectral lines depends on the Planck law, 


A P Cygni profile showing blueshifted absorption trough and doppler broadened emission towards the red. Image from Daniel Kasen, http://supernova.lbl.gov/~dnkasen/
P Cygni Spectral Line Profile
There are two components to a P Cygni spectral line profile (see Figure 1). The red-shifted emission is from the Doppler-broadened expanding shell. Gas expanding perpendicular to the line-of-sight will remain at the same wavelength as the rest wavelength, while gas expanding away from the observer will be red-shifted to lower frequencies, much like the siren of an ambulance decreases in pitch as it recedes away from us. The blue-shifted absorption feature is from the material expanding towards the observer. Since the material is coming towards us, the feature is blue-shifted, like the higher pitch of the ambulance as it drives towards us. However, because this material is at a cooler temperature than the star that it is blocking, it will be emitting at a lower intensity, and thus serve to absorb some of the light from the star behind it, resulting in an absorption feature.
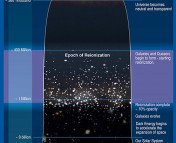
Before, I stated that the Lyman hydrogen transitions can only be observed from space because the atmosphere blocks UV light. This isn’t entirely true. The phenomenon known as cosmological redshift can shift UV light from distant objects into the optical frequencies by the time it reaches earth. Cosmological redshift is due to the expansion of the universe rather than the Doppler shift, but the resulting effect is similar. Cosmological redshift underpinned Edwin Hubble’s famous discovery that the universe was expanding, because galaxies that were farther away from us were redshifted more (and thus were expanding away from us at a faster rate), meaning that the universe itself was expanding.

Figure 2: Blueward migration of the Discrete Absorption Component (DAC) from -125 km/s to -160 km/s over the course of 1997 to 1999.
P Cygni
Astronomers have been observing the luminous blue variable P Cygni for a long time, because it is bright, and nearby; thus one can easily obtain quality spectra with relatively shorter exposures with a telescope. Studies of the star have revealed a unique spectral feature due to the Doppler effect, called the P Cygni spectral line profile (see Figure 1).
The American Association of Variable Star Observers (AAVSO) have been integral to providing continuous coverage of P Cygini, in order to detect long-term variability P Cygni.
The authors announce the discovery of micro-features in the blue-shifted absorption trough of the P Cygni profile for the Hα line, called discrete absorption components (DACs). The DAC is a smaller absorption feature superimposed upon the larger blue-shifted absorption feature. Previously, DACs had not been observed for Hα line of P Cygni. Interestingly, the authors find that the DACs will migrate blueward across the spectrum over the course of years. This means that the material forming the DAC is accelerating towards us, and becoming increasingly blue-shifted. Figure 2 tracks the acceleration of a DAC from -125 km/s to -160 km/s over the course of two years. (The negative velocity is a convention used to indicate that the absorbing component is travelling towards us, as opposed to away from us).
Traditional theory states that the DACs could be due to spirally interacting shells that result in “spots” moving across the surface of the photosphere, resulting in changes of the absorption profile. By tracking the relative strengths of the continuum emission, the Hα red-shifted emission, and the Hα blue-shifted absorption, the authors conjecture that the inhomogeneities that are causing the DACs might be relatively spherically symmetric around the star P Cygni.
Have you ever used spectroscopy before to obtain information about an astronomical source?
Where to go for more
Information on radiative transfer and spectral line formation
- Radiative Processes in Astrophysics, by Rybicki and Lightman
- Interpreting Astronomical Spectra, by D. Emerson
Information on amateur/backyard observations of variable stars
- Observing Variable Stars, Novae and Supernovae, by Gerald North
Trackbacks/Pingbacks