- Paper title: Gravity modes as a way to distinguish between hydrogen- and helium-burning red giant stars
- Authors: Timothy R. Bedding, Benoit Mosser, Daniel Huber, et al.
- First author’s affiliation: Sydney Institute for Astronomy (SIfA), School of Physics, University of Sydney, NSW 2006, Australia
Introduction
Red giants are evolved stars that have converted their supply of hydrogen into helium at their cores. This is the fate that awaits our own sun in another 5 billion years. Without main-sequence hydrogen fusion, in order to maintain enough thermal pressure to avoid gravitational collapse, the star starts burning hydrogen in a shell around a helium core. Higher temperatures result in a significantly higher nuclear fusion rate, increasing the energy output of the star drastically. This puffs up the outer layers of the star, increasing the radius of the star by over a factor of ~100; when this happens to our sun, Earth will likely be engulfed! Since the energy produced by the star is now spread over a much larger surface area, the effective surface temperature decreases, causing the blackbody spectrum to shift to longer wavelengths, making the star look redder, hence the name “red giant”.

Eventually, the red giant will begin to burn helium as well. Very interesting things can happen in this second stage of the red giant’s life. For example, for stars smaller than roughly 2 solar masses, the helium core contracts until degeneracy pressure dominates, i.e. the Pauli exclusion principle repulsion of electrons is supporting the core from collapsing. Unlike regular plasma or gas, this degenerate matter does not expand with increasing temperature; moreover, the degenerate matter is a great conductor of heat. Hence, once helium fusion ignites, there is no stabilizing expansion of the core that cools the reaction. What happens is a simultaneous helium fusion all across the core. This is known as a helium flash. The tremendous release of energy over a few seconds finally heats the core enough to make it non-degenerate, after which the core can finally expand, cool, and undergo stable helium burning.
On the contrary, for stars over 2 solar masses, the helium core ignites before it becomes degenerate, and the star never experiences a helium flash. The precise mass threshold of the star that separates these two fates depends on metallicity, mass loss, internal mixing. and core overshoot (in which the motion of convection cells in the star extend beyond the usual boundary of the convection zone.) These uncertainties are outstanding issues in our understanding of red giants.
Unfortunately, most of this action is hidden in the center of the star. Until very recently, it was impossible to see whether a red giant was still burning the hydrogen shell, whether it had begun burning the helium core, and whether a helium flash had occurred. However, using the Kepler space observatory, the authors demonstrate that they can make this distinction by using asteroseismology.
Asteroseismology
Similar to how seismologists use earthquakes to probe the interior structure of Earth, astronomers can use the many waves travelling through a star to understand its invisible interior. Some of these waves can set up standing waves, causing the entire star to change its shape and brightness regularly over hours and days. However, unlike quakes on Earth, waves on stars have no shear component (s-wave). In fact, these waves can be of 3 types:
- Pressure waves (p), also known as acoustic waves, are driven by turbulence in the star, and have pressure as their restoring force.
- Gravity waves (g) are driven by buoyancy, and have gravity as their restoring force.
- Surface gravity waves (f) are also called fundamental waves, and are akin to pond ripples on the photosphere i.e. stellar surface.
The g-waves have lower frequencies and correspondingly longer wavelengths than p-waves. Coupled with the fact that g-waves originate closer to the core, we can use g-waves to probe deeper into the star (see figure below). In our sun, p-waves are dominant, as g-waves are generated and confined below the convection zone, whereas the p-waves are generated by turbulence near the surface of the convection zone.

New Observations
The Kepler spacecraft was designed to be a planet hunter, using high precision photometry to look for tiny, regular variations in a star’s brightness due to a transiting planet eclipsing a small portion of that star’s light. However, this also makes Kepler terrific for detecting natural oscillations in the star itself.
In a red giant, due to the large density gradient outside the core, the star is effectivity divided into two zones, the envelope and the core, each dominated by p-waves and g-waves, respectively. The two zones can interact via resonant coupling, which also couple the waves, creating mixed oscillation modes (except for the angular degree l=0 radial mode, i.e. when the entire surface moves in unison, which doesn’t exist for g-waves). These mixed modes have the character of gravity waves in the core region and of pressure waves in the envelope. Due to the lower mass and inertia of the envelope, only the waves in the envelope have high-enough amplitudes to be observable. Hence, to characterize the g-waves and learn about the cores of ~400 red giants in the Kepler field, the authors measured the l=1 dipole mode of each star. The dipole mode seen on the surface is mixed, so although it’s dominated by p-waves, it also has information about the g-waves.
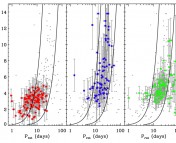
In their Nature paper, the authors show that their mixed-mode observations clearly separate red giants into two distinct populations: one with an mixed-mode oscillation period spacings of ~50 seconds (corresponding to hydrogen shell burning), and one with larger oscillation period spacings of 100~300 seconds (corresponding to helium burning); see figure below. Here the “period spacing” is the distance in period between modes of consecutive radial order; it is theoretically understood to be a key indicator of the core properties.

Fig. 3a of the paper. The horizontal axis is the p-mode large frequency spacing, while the vertical axis is the mixed-mode period spacing. Each red, orange, and blue point represents the Kepler data of one red giant; the colors are assigned based on their location on this plot, corresponding to the different populations. The blue circles are the hydrogen-shell burning stars (143 stars), while the remainder are helium-core burning stars (193 red + 61 orange).
Within the now-identified helium burning stars, using their data, the authors can make a further distinction between the co-called red clump and secondary clump. The red clump is made of low mass stars that had obtained a degenerate core and experienced a helium flash, as explained earlier in this post. This common degenerate core mass explains why the red clump spans a narrow range of properties; for example, red clump stars have similar luminosities. On the other hand, the secondary clump stars are too massive to undergo a helium flash, and thus can have a wider range of helium core masses and properties. Looking at the figure above, we can discern this division – the compact group must be the red clump (red diamonds), and the dispersed group is the secondary clump (orange squares). Of course, it’s a bit more complicated than this, do read the paper for more details!
Music
By the way, the Kepler people at NASA have converted the brightness oscillations into audio, so you can “hear” the vibrations of a red giant:

Enjoy!
Trackbacks/Pingbacks