- Paper title: The XMM-Newton Wide field survey in the COSMOS field: redshift evolution of AGN bias and subdominant role of mergers in triggering moderate luminosity AGN at redshift up to 2.2
- Authors: V. Allevato, A. Finoguenov, N. Cappelluti, T. Miyaji, G. Hasinger, M. Salvato, M. Brusa, R. Gilli, G. Zamorani, F. Shankar, J. B. James, H. J. McCracken, A. Bongiorno, A. Merloni, J. A. Peacock, J. Silverman, A. Comastri
- First author’s affiliation: Max-Planck-Institut für Plasmaphysik, Boltzmannstrasse 2, D-85748 Garching, Germany
Overview
Allevato et al. study the evolution of X-ray selected, active galactic nuclei (AGN) in order to help understand how these massive, central black holes are triggered and fed, and how they interact with their host galaxies and dark matter halos. Using measurements of the two-point correlation function, the authors measure the AGN clustering bias relative to the clustering of dark matter (DM) halos. After providing a new method for estimating a weighted bias, Allevato et al. offer evidence that the AGN bias evolves with redshift — from b(z = 0.92) = 2.30 ± 0.11 to b(z = 1.94) = 4.37 ± 0.27 — which supports a framework in which the host DM halos are constant in time. Subdividing their sample of AGN, they find that broad-line (BL) AGN occupy higher mass halos than their narrow-line (NL) AGN counterparts: log M ~ 13.28 ± 0.07 compared to log M ~ 13.00 ± 0.06, respectively. Finally, the authors suggest that theoretical models of AGN triggering that rely on major mergers cannot reproduce the large bias factors, and thus that the contribution from these mergers must be subdominant to other physical processes.
The AGN Catalog
Allevato et al. select a sample of 593 AGN from a total XMM-COSMOS sample of 1465 AGN detected in the soft X-ray (0.5-2 keV) band. They do so by restricting their target sample to a redshift z < 4 and by making a magnitude cut of IAB < 23. They note that the magnitude cut increases their spectroscopic completeness from 53% to 65%. The median redshift of the restricted AGN sample is <z> = 1.22.
The Allevato et al. sample is further split into BL and NL AGN (354 vs. 239) based on classifications from Brusa et al. (2010). X-ray unobscured and X-ray obscured subsamples are also selected (184 vs. 218) based on their hardness ratios, using the hard X-ray (2-10 keV) band observations that were available in addition to the soft X-ray band in which the AGN had been initially detected.
Correlation Statistics
A classic technique for measuring the clustering of astronomical objects is the correlation function, , which measures the excess probability of finding an object at a distance, r, from another random object. Since peculiar velocities of objects affect their redshift measurements, it is common to integrate over the redshift dimension,
, leaving only a projected correlation function:
wp (rp ) = 2
In practice, this integral is truncated when the integral begins to converge. To calcualate the bias, the standard method would be to plot the correlation function, wp (rp ), of the AGN versus rp, and to fit a power-law, and extract the best-fit length and slope. From these parameters, the bias can be calculated as the ratio
b = σAGN(z)/σDM(z)
where σ is the root-mean-squared spread of the density distribution in a co-moving sphere of a given radius. In this paper, the authors adopt a different approach. They use a model where the overall correlation function is the sum of two components: the 1-halo and the 2-halo term. The 1-halo term accounts for correlations of objects within the same DM halo. The 2-halo term accounts for large-scale structure and thus the distributions of one halo with respect to another. Hence, on large scales in which linear density fluctuations dominate,
wp = wp(1-halo) + wp(2-halo) ~ wp(2-halo)
The authors thus calculate the AGN bias
= wp (2-halo,AGN) / wp (2-halo,DM)
While this returns the same bias measurements as the power-law method, the authors prefer this method to the halo method, since the correlation function is not exactly a power-law, and thus fitting for one introduces additional error. While perhaps ultimately preferable, the halo method is model dependent, in that DM correlation function relies on the linear power spectrum, which itself assumes an underlying cosmology. Moreover, the the 2-halo term does not differentiate between central and satellite DM halos, and in this sense, remains a simplification of large scale structure. On the other hand, in practice, the approach taken by the authors is powerful, as it naturally lends a consistent method of calculating the DM halo that the AGN occupies.
The authors merely equate the halo-mass-dependent bias as derived from a halo occupation distribution (HOD) model with the bias as calculated in the immediately previous equation, above. Whatever mass solves the following equation equation is assumed to be the host halo mass.
b(M) = b = (wp (2-halo,AGN) / wp (2-halo,DM))1/2
Results
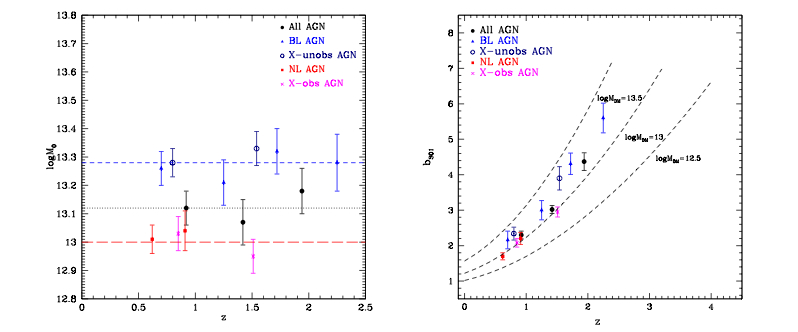 In Figure 9, the authors present their primary results: AGN bias evolves in redshift for both the complete sample, and for the various subsamples of BL/NL and unobscured/obscured. These results agree with previous literature, by suggesting that AGN reside in moderate size DM halos of log MDM ~ 13 ± 0.5. Moreover the BL/unobscured AGN had host halos approximately log MDM~ 0.3 greater than their NL/obscured counterparts. This, the authors argue, shows that AGN triggering is specifically mass-dependent, regardless of at which redshift that mass is present. Thus, these phases would be indicative of different epochs in the course of AGN/galaxy evolution.
The authors compare their work with previous bias evolution measurements. From this (Figure 10), it is clear that at this point, systematic differences in measurement techniques and model assumptions are greater than the statistical errors, as evidenced by the disagreement between various methods, despite the small error bars. This points to the need for more independent observations of host halo mass, rather than merely increasing the sample sizes with larger, upcoming surveys.
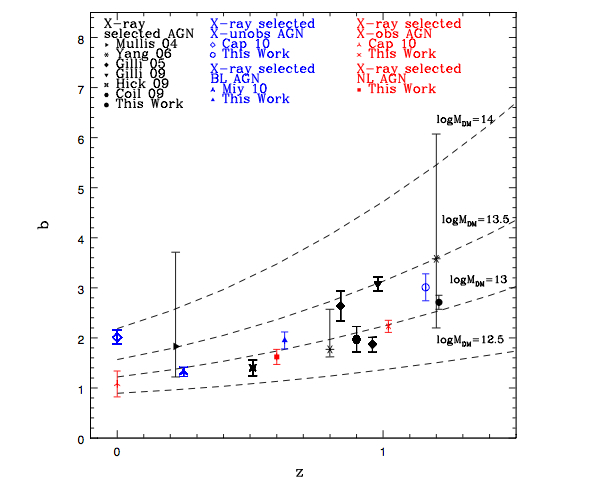
Fig. 10.— Bias parameter as a function of redshift for various X-ray selected AGN (black data points), X-ray selected BL/X-unobs AGN (blue data points) and X-ray selected NL/X-obs AGN (red data points) as estimated in previous studies and in this work according to the legend. Our results refer to the bias factor bS01 showed in Table 2 col (5). The dashed lines show the expected b(z) of typical DM halo masses MDM based on Sheth et al. (2001). The masses are given in logMDM in units of h−1M⊙. (Original caption, Allevato et al. 2011)
Conclusions
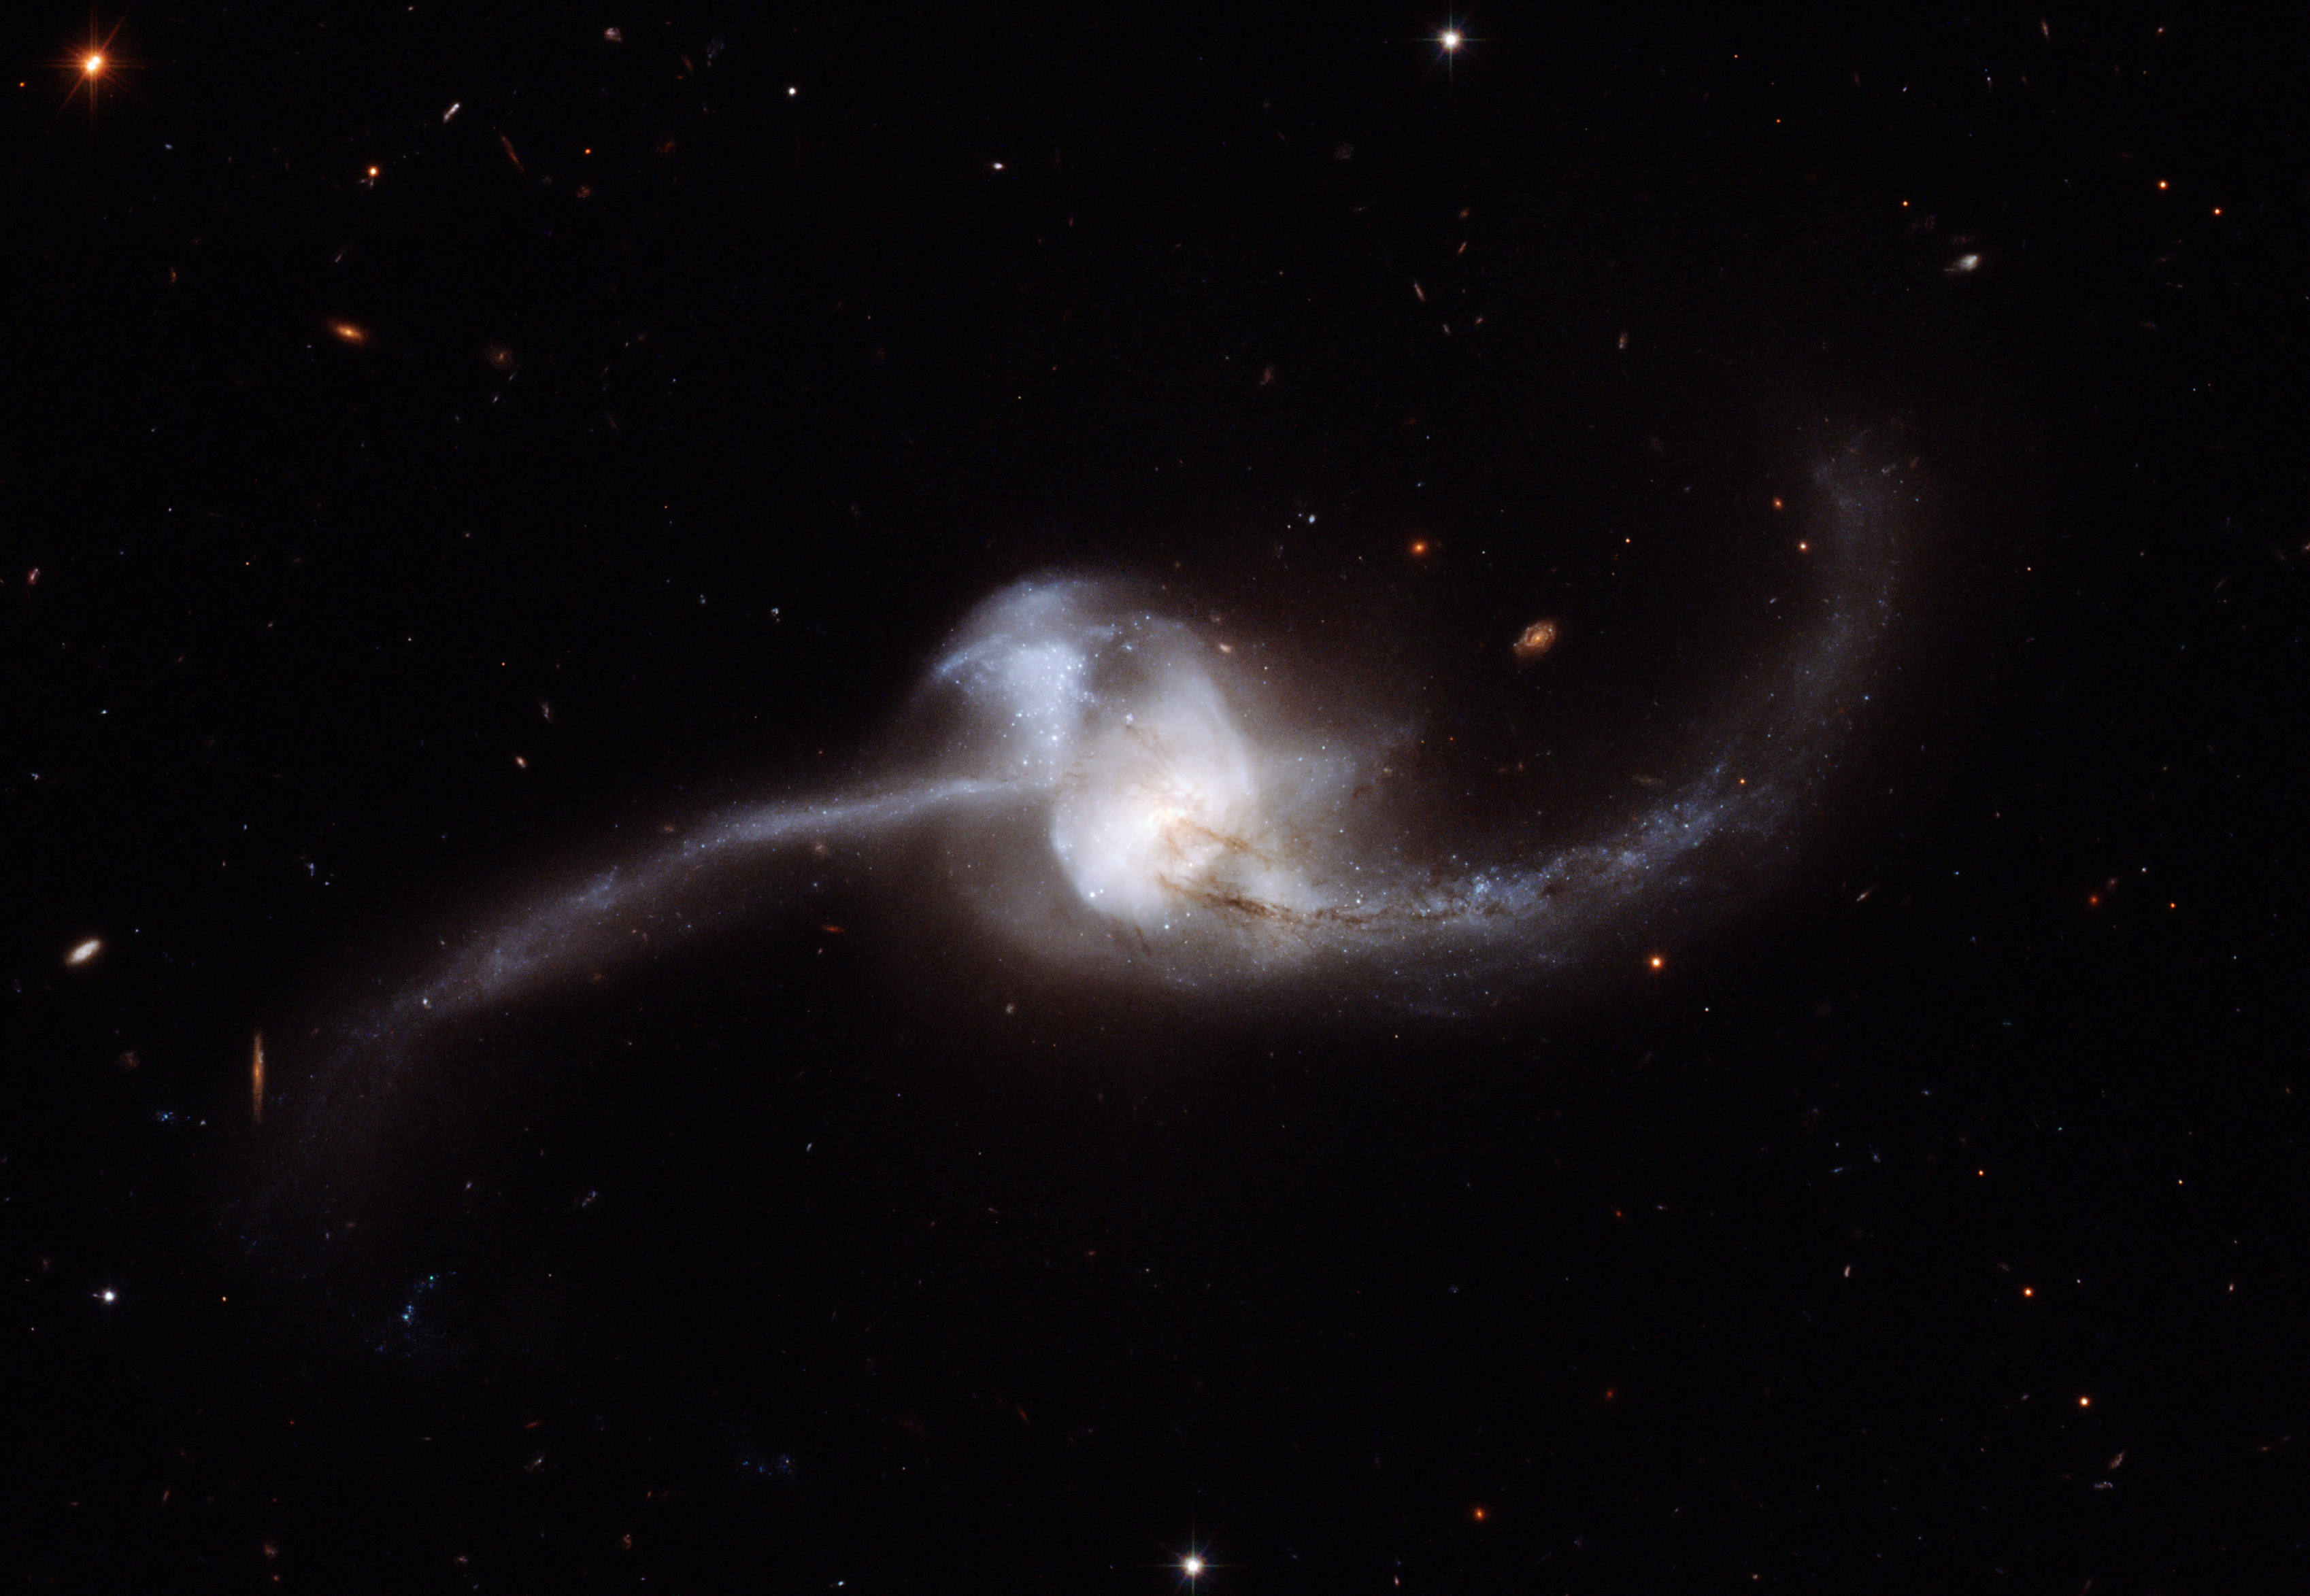
Theoretical models and simulations have suggested that major mergers may be responsible for fueling AGN activity. But the high calculated bias in these authors’ work (Figure 12, blue triangle) lies far above the theoretical model of Shen (2009; Figure 12, black line). This, the authors argue, supports models in which AGN activity is triggered by internal processes such as quiescent cold gas accretion, disk instabilities, and stellar winds, rather than external processes such as a major merger with another galaxy, and the violent accretion of large quantities of gas. The authors do not contend that mergers play no role, especially in the brightest AGN. But for moderate luminosity quasars, they provide evidence for the importance of other factors.

Fig. 12.— Predicted bias as a function of luminosity, computed according to Shen (2009) fixing z = 2, compared to previous bias estimates at 1.8 < z < 2.2, for optically selected BL AGN and for XMM-COSMOS BL AGN. Points are measurements from Croom et al. (2005, green-crosses), Porciani & Norberg (2006, green-star), Shen et al. (2009, green-open square), da Aˆ ngela et al. (2008, green-circles), Myers et al. (2007, green-squares) and our re- sult (blue triangle). For ease of comparison, all luminosities are converted to bolometric luminosities using the corrections from Hopkins et al. (2007). The theoretical model which assumes a quasar phase triggered by major merger reproduces the results ob- tained for the bias of quasars, but can not reproduce the high bias factors found for X-ray selected BL AGN and then can not explain why optically selected quasars that have higher bolometric lumi- nosity compared to COSMOS X-ray selected BL/X-unobs AGN, reside in more massive halos. These differences suggest a switch to a different dominant mechanism for AGN triggering, from ma- jor mergers between gas-rich galaxies to secular processes as tidal disruptions or disk instabilities. (Original caption, Allevato et al. 2011)

