- Paper title: Combining Kepler and HARPS Occurrence Rates to Infer the Period-Mass-Radius Distribution of Super-Earths/Sub-Neptunes
- Authors: Angie Wolfgang, Gregory Laughlin
- First author’s affiliation: Department of Astronomy and Astrophysics, University of California, Santa Cruz, CA
In my last astrobite I discussed a paper by Gaidos et al. about combining the exoplanet radii measured by Kepler with the masses measured by the M2K Survey in order to probe the density distribution of exoplanets. As promised, my astrobite today will cover another recent paper about combining data from radial velocity surveys with data from Kepler.
Summary
The main question addressed by Wolfgang & Laughlin is how to reconcile the relatively high occurrence rate of Super-Earths and Mini-Neptunes reported by the High Accuracy Radial velocity Planet Search (HARPS) with the lower occurrence rate announced by the Kepler team. The HARPS team posted a paper on September 12 containing detailed information about the occurrence rate and mass distribution of RV detected planets, but that paper was not yet on the arXiv when Wolfgang & Laughlin posted their paper. Instead, Wolfgang & Laughlin chose to compare the preliminary HARPS result that 30-50% of Sunlike F and G stars harbor planets less massive than Neptune to the result from the Kepler team that only ~15% of stars host planets smaller than 4 Earth radii with orbital periods less than 50 days.
Since RV surveys measure masses while transit surveys measure radii, comparing the two occurrence rates requires a relationship between radius and mass. If all of the planets have the same density, then the problem would be simpler because a planet with a larger radius would always be more massive. However, Wolfgang & Laughlin find that a heterogenous mix of both rocky planets and gaseous planets produces a better fit to the Kepler and HARPS data than does a population consisting solely of planets with the same density. They also find that small planets are preferentially rocky, which is good news for astronomers looking for Earth-like planets!
Simulated Planet Population
Wolfgang & Laughlin begin their analysis by generating a population of planets drawn from a power law distribution in mass and orbital period. They require an orbital period of 2-50 days and restrict the planet mass to between 1 Earth mass and 1 Neptune mass. For each planet, Wolfgang & Laughlin draw an orbital eccentricity from a uniform distribution between e=0 (circular) and e=0.2 (same eccentricity as Mercury). They assume that planetary inclinations are randomly distributed and draw a random inclination for each planet.
Mass-Radius Relation
After determining the masses and orbital parameters of their population of planets, Wolfgang & Laughlin apply a mass-radius relation to set the radius of each planet. They initially use a single-valued mass-radius relation in which the radius of a planet scales with the 0.48 power of the mass, but they also investigate a multi-valued mass-radius relation that allows for a mixture of rocky planets and gaseous planets.
In the multi-valued mass-radius distribution, the fraction of rocky planets decreases linearly with increasing planet mass. Wolfgang & Laughlin vary the fractions of rocky planets at both the low-mass and high-mass ends of the distribution to test a range of multi-valued mass-radius relations. Regardless of the specific choice of multi-valued mass-radius relation, the radii of rocky planets are calculated from a mass-radius relation fit to the terrestrial planets in the Solar System. The initial radii of gaseous planets are calculated from the mass-radius relations derived by Rogers et al. 2011 and Wolfgang & Laughlin also incorporate atmospheric mass loss due to irradiation from the host star. The figure below displays the periods and radii of the Kepler planet candidates and a population of planets generated from the multi-valued mass-radius distribution.

Radius and period distribution of Kepler candidates and simulated planets generated from the multi-valued mass-radius relation. The black dots mark Kepler candidates and the colored symbols denote simulated planets. The red plus signs are rocky planets, the green diamonds are gaseous planets, and the blue asterisks are gaseous planets that have undergone significant mass loss due to stellar irradiation. Figure 4 from Wolfgang & Laughlin 2011.
Comparing to the Kepler Results
Next, Wolfgang & Laughlin assign each of the simulated planets to a Kepler target star and generate the light curves that would be produced for the transit of each simulated planet around its assigned host star. The Kepler team requires a signal to noise ratio (SNR) of 7.1 for the detection of a transit, so Wolfgang & Laughlin count all simulated planets whose transits are detected with SNR>7.1 as detected planets.
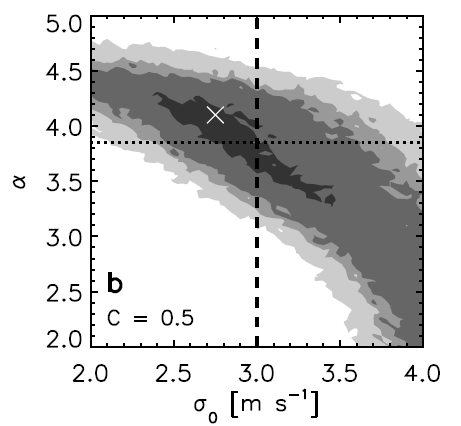
In order to assess how well the modeled distribution of planets reproduces the Kepler results, Wolfgang & Laughlin apply a two-dimensional K-S test to the radii and period distributions of the simulated planets and the Kepler candidates. Since K-S tests are most sensitive to the means of the distributions (i.e., medium size planets in medium length orbits), Wolfgang & Laughlin also perform a chi-squared test to compare the planet radii to ensure that the population of small planets is well-matched. Wolfgang & Laughlin vary the mass power law index, period power law index, and rocky planet fraction (as a function of radius) to test a variety of underlying planet distributions. As shown in the figure below, the Kepler candidate list is best matched by a model planet population in which most small planets are rocky (70-100% rocky at 1 Earth mass) and most large planets are gaseous (0-20% rocky at 1 Neptune mass).

The number of detectable simulated planets as a function of rocky planet fraction and mass power law index. Each of the grid plots is colorcoded to display the number of detectable planets that would be expected if the fraction of rocky planets at 1 Earth mass were given by the value on the x-axis and the fraction of rocky planets at 17 Earth masses (roughly 1 Neptune mass) were given by the value on the y-axis. The period power law index is set to the best-fit value of 0.0 for all three plots and the mass power law index is varied between -1.1 and -0.9 as indicated in the upper right corner of each plot. The white boxes on each plot highlight the rocky planet fractions that produce populations of simulated planets that best match the observed population of Kepler candidates. Figure 6 from Wolfgang & Laughlin 2011.
In summary, both Wolfgang & Laughlin 2011 and Gaidos et al. 2011 argue that small planets are predominantly rocky. They begin with different radial velocity data sets, but both teams arrive at the same conclusion. Given the recent paper by the HARPS team, we should expect to see even more exciting results about the mass-radius-period distribution of exoplanets in the near future.
Trackbacks/Pingbacks