Authors : Michael Bessell & Simon Murphy
First Author’s Institution : RSAA, Mount Stromlo Observatory, The Australian National University, ACT 2611, Australia
Sounds like a simple question. When you go out and look at the stars at night with your naked eye, you might be able to pretty easily sort out which stars are the brightest, which are the faintest, and come up with some ranking of them for those in between.
Now, do this with telescopes, and instead of just saying “this one is brighter than that one,” make some quantitative statement as to how much brighter one star is than the next. If everyone used the same telescope, it would be relatively straightforward to compare measurements of flux as registered as events on the detector of our camera (which is essentially what happens with our aforementioned naked-eye measurements). However, the question becomes more complicated when people start using different telescopes and detectors that have varying sensitivities to different colors of light.
The practice of measuring the brightness of an astronomical object is called photometry. Accurate photometric measurements are supremely important for measuring the Type Ia supernovae that are part of the cosmic distance ladder, measurements of exoplanet transits, variable stars and quasars, and generally nearly any field of observational astronomy.
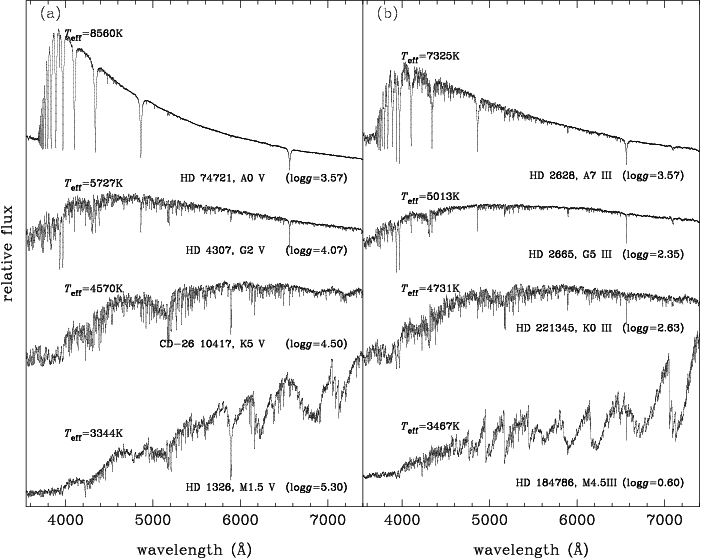
In their new paper on the arXiv, Bessell and Murphy use spectrophotometric data from the Next Generation Spectral Library (NGSL) and the Medium Resolution INT Library of Empirical Spectra (MILES) to evaluate the accuracy of some current photometric practices. These libraries are of moderate resolution, flux-calibrated spectra of stars, many of which are “standard stars” that define photometric systems (Figure 1).
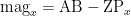
Astronomers like to measure the flux from astronomical objects through filters, which block out certain wavelengths of light and allow others to pass through. The most commonly used photometric filters are broadband filters like the Johnson-Cousins UBV RI filter set. These filters are defined by system response functions, which is the sensitivity of your instrument to light as a function of wavelength (Figure 2). So, when you use a telescope with a filter to make photometric measurements of an astronomical object, you are (ideally) sampling the spectrum of the astronomical object weighted by the system response function as a function of wavelength.

Figure 2. (Figure 9 from Bessell et al 2011). The system response functions for the U,B,V,R, and I filters of the Johnson-Cousins filter set (the black curves from left to right, respectively). These curves have been normalized to 1. The curves represent the relative of fraction of light that is detected by the CCD detector as a function of wavelength.
In actuality, however, each filter on camera on each different telescope has a slightly different response function due to the difficulties of manufacturing identical instruments. Therefore, when astronomers do photometry they must observe a standard field of stars and compare the values of their measurements to the published values in order to determine just how their different their instrumental setup is from the ideal case. In this way, astronomers arrive at a measurement of the magnitude of an astrophysical source, which is related to the flux measured by a telescope.
The zero-point (ZP) is an offset used to correct an “instrumental magnitude” measured by your specific telescope to an actual, standard magnitude. There are also color terms, extinction, and airmass terms that are needed to make these transformations, that won’t be mentioned here, but are further discussed in greater detail in Phil Massey’s tutorial on how to do photometry with IRAF, a software program used for the reduction of optical data.
The magnitude is defined as
where
Here we see that our photometric measurement is the spectrum of the astronomical object 


We can define the mean photon wavelength of the passband as

We can define an effective wavelength as

The spectrum of Vega is shown in Figure 3 with the mean photon wavelength 


Given the history of photometric measurements recorded in the astrophysical literature, there should exist some theoretical passband (the system response function

Trackbacks/Pingbacks