Authors: Erica J. Nelson, et al.
First Author’s Institution: Yale University
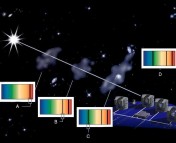
The galaxies we observe at z (redshift) = 2 are irregular, clumpy-looking things. It’s no wonder: only 3.5 billion years have passed since the Big Bang. Optical and near-infrared images of four high-redshift star-forming galaxies (shown in Figure 1) show just how clumpy these galaxies can be.

Figure 1: Four clumpy star-forming galaxies observed in the optical and H-alpha (Genzel et al. 2011).
A quick look around at the spiral galaxies in the neighborhood will reveal that massive galaxies are qualitatively different at present, 10 billion years later. Much work has been done to understand the global evolution of star-formation rate and stellar mass with redshift (e.g. Daddi et al. 2007), but what we don’t know is how or where the star-formation occurs within a galaxy as it grows. Z=1 galaxies are thought to be transitioning from the irregular morphologies seen at z=2 to the regular morphologies seen locally, and are therefore an interesting place to look for clues about the characteristics of the transition. A key question the authors ask is, are galaxies in this redshift window growing their bulges, disks, or both?
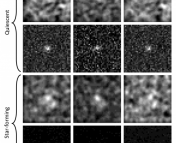
The authors tackle this question by comparing the relative areas of star-formation and stellar continuum in 57 z~1 galaxies. One way to measure star formation is through Hα emission, a well-characterized and robust indicator of star formation. Ultraviolet (UV) photons from O- and B-type stars ionize nearby hydrogen, which will quickly recombine and emit copious Hα photons. The lifetime of these UV-producing stars is short enough that Hα emission can be taken as an indicator of star formation. In contrast, the existing stellar populations will include very few massive stars: the optical luminosity will be dominated by medium-mass main sequence stars and giants, which both emit primarily optical photons. Thus a broad (rest frame) r-band map of a galaxy will trace the existing stars, and a Hα map will trace the star-formation activity. Figure 2 shows the continuum images and Hα maps of four galaxies from the sample. The spatial resolution is 0.5 kpc, ample for resolving the relevant features in these extended sources.

Figure 2: Each column shows the stellar continuum image (top) and Ha map (bottom).
The authors compute a half-light radius for both continuum and Hα emission in each galaxy. Comparing the Hα radius to the continuum radius tells us about the growth of that galaxy. If the Hα radius is smaller than the continuum radius, then growth is occurring preferentially in the inner parts of the galaxy, perhaps the bulge. If instead the Hα radius is greater than the continuum radius, the implication is that the galaxy is building its outer parts. Light from existing stellar populations in the inner part of the galaxy implies that growth began with a small central region and is expanding outward. Indeed, the average ratio of Hα radius to continuum radius (the “radius ratio”) is 1.3 (+/- 0.1), favoring, on average, this inside-out growth.
A different picture emerges when the authors divide the sample into two groups: those below the median absolute Hα size and those above. The mean radius ratio of the smaller galaxies is consistent with unity, while the mean radius ratio for the larger galaxies is closer to 1.5. The implication is that the inside-out growth model is relevant only to larger galaxies.
The emergence of two populations within the sample begs the question: what differentiates them? The authors offer two explanations: 1.) The sample is comprised of an evolutionary sequence. The physically smaller galaxies are building their bulges. The other half of the sample has already built its bulge and has begun building a disk. 2.) Alternatively, the populations could be distinct. It is feasible that the small, compact galaxies observed in this study will remain small, never to develop a stellar population in the disk.
As with any study, it is important to consider the impact of the limitations on the results. In this case, differential dust extinction has an unknown effect on the observed Hα flux and therefore the calculation of the Hα radius. The authors point to the use of other spectral features in the future as a way of measuring the differential extinction.
Trackbacks/Pingbacks