Paper title: Spitzer Imaging and Spectral Mapping of the Oxygen-rich Supernova Remnant G292.0+1.8
Authors: P. Ghavamian, K. Long, W. Blair, S. Park, R. Fesen, B. Gaensler, J. Hughes, J. Rho, P. F. Winkler
First Author’s Affiliation: Towson University, Maryland
A star ends its life in a violent supernova (SN) explosion according to one of two (general) mechanisms — (1) core-collapse, forming a neutron star or black hole and an extremely energetic shock wave; or (2) thermonuclear explosion of a white dwarf, leaving no central remnant and releasing a very characteristic amount of energy used to infer the distance to these standard candles. Core-collapse SNe can be further classified according to their progenitor stars as type II, Ib or Ic, while thermonuclear supernovae are known as type Ia. More discussion on types of SNe can be found here, or in this Science in the News piece by another astrobiter.
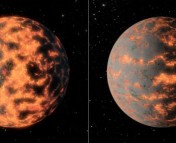
One way to better understand how SNe progress is by studying the leftovers, or remnants, of these events (if you like supernova remnants, check out this astrobite too). For example, G292.0+1.8 is a collection of cosmic remains from an unrecorded supernova event that probably occurred about 3000 years ago, and it is unique for its oxygen-dominated optical spectra — hence, its classification as an oxygen-rich supernova remnant (SNR). Moreover, G292 is the remnant of a core-collapse SN, with filaments of gas and dust emitting light as shocks from the SNR propagate outward into the circumstellar medium. The goal of today’s paper is to study emission from G292 at different wavelengths in order to investigate the energy and the morphology of core-collapse SNe.
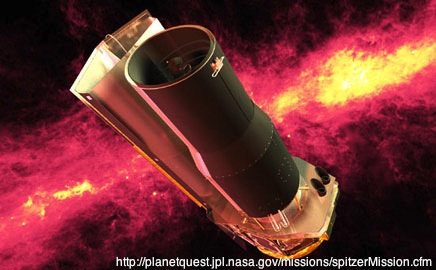
Observations of G292 at different wavelengths show distinct features. To give you an idea, optical images show a crescent-shaped structure known as the “spur” on the eastern side of the SNR, as well as a collection of fast-moving knots (FMKs, a.k.a. filaments, sort of like clumps). Radio observations reveal an elliptical shell, and X-ray emission indicates shocks within the lower density interstellar gas throughout the region. This paper presents observations using the MIPS and IRS instruments on the Spitzer Space Telescope, which I will describe and show below (on a related note, Spitzer not only studies the death of stars, it also studies the birth of stars, as described in this astrobite).
MIPS Observations

Observations with MIPS (a Multi-band Imaging Photometer), at wavelengths of 24 and 70 microns (mid-Infrared), reveal emission from warm circumstellar dust being heated by shocks (i.e. excess energy resulting from the SN collapse propagates outward and excites the surrounding dust). In the lower row of the above figure, the optical image centered on a ionized oxygen line [O III] and the Chandra X-ray images show distinct features from the MIPS 24 and 70 micron images on the top, which are presented by these authors. Specifically, look at the oxygen-rich “spur” in the lower-left image, in contrast to the shock-heated dust revealed in the elliptical shell and the equatorial belt region seen in the upper MIPS images.
IRS Observations

IRS (InfraRed Spectrograph) maps of emission betwen 14 and 36 microns are used to identify the oxygen-rich knots and magnesium silicate dust that have been excited by a shock wave from the SN (more specifically, the reverse shock follows the first shock wave, exciting the expanding ejecta — think of the traffic jam that slows you to a halt on the highway). The images above show neon, oxygen, iron, and some silicon filaments, compared with the strong emission from shock-heated circumstellar gas seen with IRS (15-25 microns in the lower right image). The contour outline in each image indicates the region of X-ray emission detected by Chandra. The lack of silicon emission in the southeast (lower left) indicates that the shock wave hasn’t arrived here yet, and the explosion may have been asymmetric.
Conclusions
(1) Temperatures of dust gains in the SNR depend on the density of the surrounding gas. Specifically, there should be more X-ray emission in regions of high gas density, and also more IR emission in very hot dusty regions. One way to investigate this is by comparing the X-ray intensity with ratio of the 70 and 24 micron MIPS detections. The authors find that generally, bright X-ray emission corresponds to regions of small 70/24 flux ratios (more 24 micron than 70 micron emission), with a few exceptions in the southwestern region. They conclude that this region has higher than average amounts of dust compared to gas.
(2) The IRS observations detect no silicon emission in the southeast region of the SNR, and the authors conclude that the reverse shock has not penetrated that region yet. They propose that the SN explosion was asymmetric, which may have broader implications for the mechanism by which stars end their lives. More and more SNRs are observed to be asymmetric, but it is still very difficult to model asymmetric explosions, shocks, etc (what’s causing the asymmetry?), which makes observations and images like those presented here that much more important.