Title: Imaging Simulations of the Sunyaev-Zel’dovich Effect for ALMA
Authors: Kenkichi Yamada, Tetsu Kitayama, Shigehisa Takakuwa, Daisuke Iono, Takahiro Tsutsumi, Kotaro Kohno, Motokazu Takizawa, Kohji Yoshikawa, Takuya Akahori, Eiichiro Komatsu, Yasushi Suto, Hiroshi Matsuo, and Ryohei Kawabe
First Author’s Institution: Department of Physics, Toho University, Funabashi, Chiba 274-8510, Japan
Today’s paper bridges theory and observations, particularly related to two topics previously discussed in astrobites: the Sunyaev-Zel’dovich Effect and observations with ALMA. Let’s deconstruct these two topics, and then see what they have to do with each other, specifically simulations of ALMA observations presented by Yamada et al.
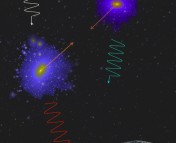
Sunyaev Zel’dovich Effect — Several astrobites address the Sunyaev Zel’dovich (SZ) effect and its importance to astronomy, beginning with this post, and most recently in a paper about Scaling the SZ Effect in Clusters, for example. Briefly, the SZ effect is the inverse Compton scattering of radiation from the cosmic microwave background (CMB) off of hot electrons in galaxy clusters. In other words, as photons from the CMB travel towards us, and pass near electrons in hot galaxy clusters, the photons gain some energy. This effect depends on the number of electrons, but not on distance, and observations of the SZ effect are used to probe characteristics of the galaxy clusters (very large gravitationally bound collections of galaxies) of the early universe. One challenge in observing the SZ effect with current telescope facilities is that the spatial resolution (the smallest scale that the observations can distinguish) is generally not sufficient to study the details of structures in distant merging clusters.
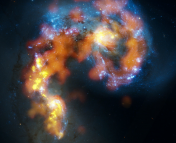
ALMA — The Atacama Large Millimeter/submillimeter Array (ALMA) is an observatory currently being constructed in northern Chile. When it is finished, it will consist of 66 antennas, composed of a main array of 12-meter antennas and a more compact array of 7- and 12-meter antennas, which will observe frequencies between 30 GHz and 950 GHz (corresponding to “mm and sub-mm” wavelengths of 0.003 to 0.0003 meters). Observations have begun with a subset of the antennas, already the most advanced interferometer of its kind, and antennas will continue to be added to the array throughout the year (for more information on the antennas, check out this post). For example, ALMA has observed with unprecedented detail the molecular gas in the merging Antennae Galaxies, explained in this astrobite. Many more science goals will be addressed with ALMA, including studying the early universe, and for this, it will be important to understand the capabilities of ALMA to observe the SZ effect.

ALMA antenna configuration used in these simulations. Blue represent 12m diameter dishes, and red 7m dishes (the ALMA Compact Array). Both subsets of antennas are important, the 12m for the larger collecting area (cumulative sizes of dishes) and longer baselines (distance between antennas), and the 7m for the small spacings which allow detection of more diffuse structure.
Paper Summary — The authors of today’s paper simulate the images we expect to get with ALMA when it is completed. They decide to use the most compact ALMA configuration (with distances between antennas up to about 150 meters), and to “observe” radiation with frequency of 90 GHz. To understand observations of different types of objects, they simulate three models:
Model A: Gaussian — a simple circular image that is brightest at the center and decreases in brightness (in the shape of a gaussian) towards the edges. With this, the authors can test “fidelity” (how well the mock observations recreate the known simulation inputs) at different spatial extents of the image. The combination of many antennas is important for imaging the smallest features, while the single dishes are important for recovering emission on larger spatial scales. (Aside: This is because the scale at which an observation is sensitive depends on the ratio of the largest to smallest baselines, the distance between any two antennas. You can pretend that a single dish is an interferometer with an infinite number of baselines within its dish, the smallest being zero, and the largest being the diameter of the dish.)

Fidelity is a measure of how well the observation represents what is actually being observed. In the case of simulated observations, the input is known, so the output can directly be compared. Here, different colors/shapes represent observations with a different subset of antennas and configurations. Using all antennas (combining different sub-configurations) results in the best observations.

Another way to test the results is to compare the intensity (y-axis) of the detected SZ emission at different locations (x-axis) between simulated data (the input, dashed lines) and the simulated observations (red, with error bars). Here, the simulated observations agree well, except in the region at the edges, where there is a shock front.
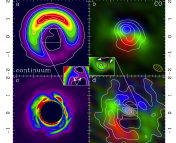
Model B: Bullet Cluster — The next model uses the 3D hydrodynamic simulations of a cluster merger based on observations of the Bullet Cluster, an excellent example of the role of dark matter and gas in cluster collisions. Inputing the simulated data, the authors determine how ALMA observations would detect the global structure of a real cluster. Since, in this case, the object being “observed” is completely known, the authors can compare the input (simulated data) with output (simulated observations). Comparing the intensity of emission at different locations in the map, the overall structure of the mock-cluster is accurately imaged, but where the shock of the collision occurs there is a discrepency in detected emission.
Model C: The shock front — Finally, the authors investigate specifically the region where gas is colliding (the shock front) during the simulated galaxy cluster interaction. They show that with high resolution ALMA data, intensity, temperature and pressure determined from the observations are accurate representations of the input simulated data. This is true even at high redshifts, making ALMA a promising tool for studying shocks as remnants of galaxy cluster collisions early in the universe. The authors determine the integration time and specific configuration of antennas and frequencies which will best detect these features with ALMA. They will be well-prepared for proposals and observations with the completed ALMA array in the near future, revealing the details of the SZ effect, and hence the galaxy cluster environments of the early universe.

Evaluating the accuracy of the simulated observations, specifically for a shock front region (where galaxies are colliding). Upper left shows the input data, to be compared with the output simulated observations. Notice that different array configurations have different resolution, and recover signals related to different physical scales. The fidelity map shows which regions are best represented with the observations (best are in red).
Trackbacks/Pingbacks