- Paper Title: On the effects of the evolution of microbial mats and land plants on the Earth as a planet. Photometric and spectroscopic light curves of paleo-Earths.
- Authors: Sanroma, Palle, Munoz
- First Author’s Affiliation: Instituto Astrofisica de Canarias, La Laguna, Spain
- Journal: The Astrophysical Journal (Accepted)
Introduction
As we discover exoplanets in droves and the first hints of habitable worlds emerge, astronomers are starting to look to the next step: the search for life on those worlds. This is a complex, challenging task, and will have to proceed in stages. It’s unlikely that we’ll be able to distinguish life on a planet from any single observation: while methane in the presence of oxygen is the best remote biosignature on Earth, volcanoes also put out methane. Differentiating between biotic and abiotic signatures will require putting together a complete picture of the candidate planet, including atmospheric structure, geological processes, and its dynamical history, to conclusively rule out abiotic explanations for the supposed biosignature. We can imagine having a set of candidate habitable planets that are studied in increasing detail over time with better instruments and techniques, refining down the list until we are at last able to claim detection of life.
This theoretical paper explores what telescopic observations could tell us about the broad states of the continents of an exo-Earth, using our own Earth’s history as a model. While the Earth today is lush and green, covered by vegetation, this was not always the case. Advanced plant life only took over the continents about half a billion years ago (though simpler life such as algae may have emerged earlier). Microbial mats emerged 3.5 billion years ago. Prior to this, for almost a billion years the Earth was lifeless. As a first step to characterization, the authors ask if we could distinguish between these three stages of planetary development using telescopic observations.
Methods
The authors simulate visible and near-IR disk-integrated spectra (averaged over the face of the planet) of the Earth using a radiative transfer model. They consider different stellar illumination angles for the planet, and different viewing angles for the observer. Of these, the geometry of the most interest to us is the one that corresponds to us seeing the planet in it’s “half-moon” phase, as that means the planet will be maximally separated from it’s star from our point of view. This is the ideal case for direct imaging of the planet, which is the technique that can best reconstruct disk-integrated spectra.
The authors assign the distribution of continents to be that of Earth during the Late Cambrian 0.5 billion years ago. They consider five atmospheric profiles based on conditions observed on Earth: tropical, midlatitude summer and winter, and arctic summer and winter. They consider four different types of land: water, desert (lifeless), forest, and microbial mat. They include the effect of clouds, differentiating between low, mid and high level clouds. They use meteorological data from the Earth today to assess how cloudy it is at each of these levels as a function of latitude and underlying terrain type. There’s no empirical data on the cloudiness over microbial mats as nowhere do mats dominate enough to exhibit a clear signature. To compensate, they consider the cloudiness of the mats to be the same as first the desert (case 1) and the forest (case 2). The true cloudiness profile should be intermediate. However, the authors find the results not to be very sensitive to the choice of cloud profile, so this doesn’t matter quite as much.
Results
The main information that can help differentiate between the different types of continental land-mass is the variability: over the course of a day, how much does the light reflected by the planet change, as landmasses rotate in and out of view? While in principle this could be done on a spectroscopic basis, in practice this will likely require the use of broadband photometry to achieve high enough signal-to-noise for meaningful conclusions. The authors therefore convolved their planetary spectra against standard astronomical filters such as BVRIz (visible light) and JHK (near-IR) to simulate these observations. One exciting note is that such observations could be used to constrain the planet’s rotation period! This could be essential in studying, for example, planets around M-dwarfs that might be tidally locked, which could affect their habitability.
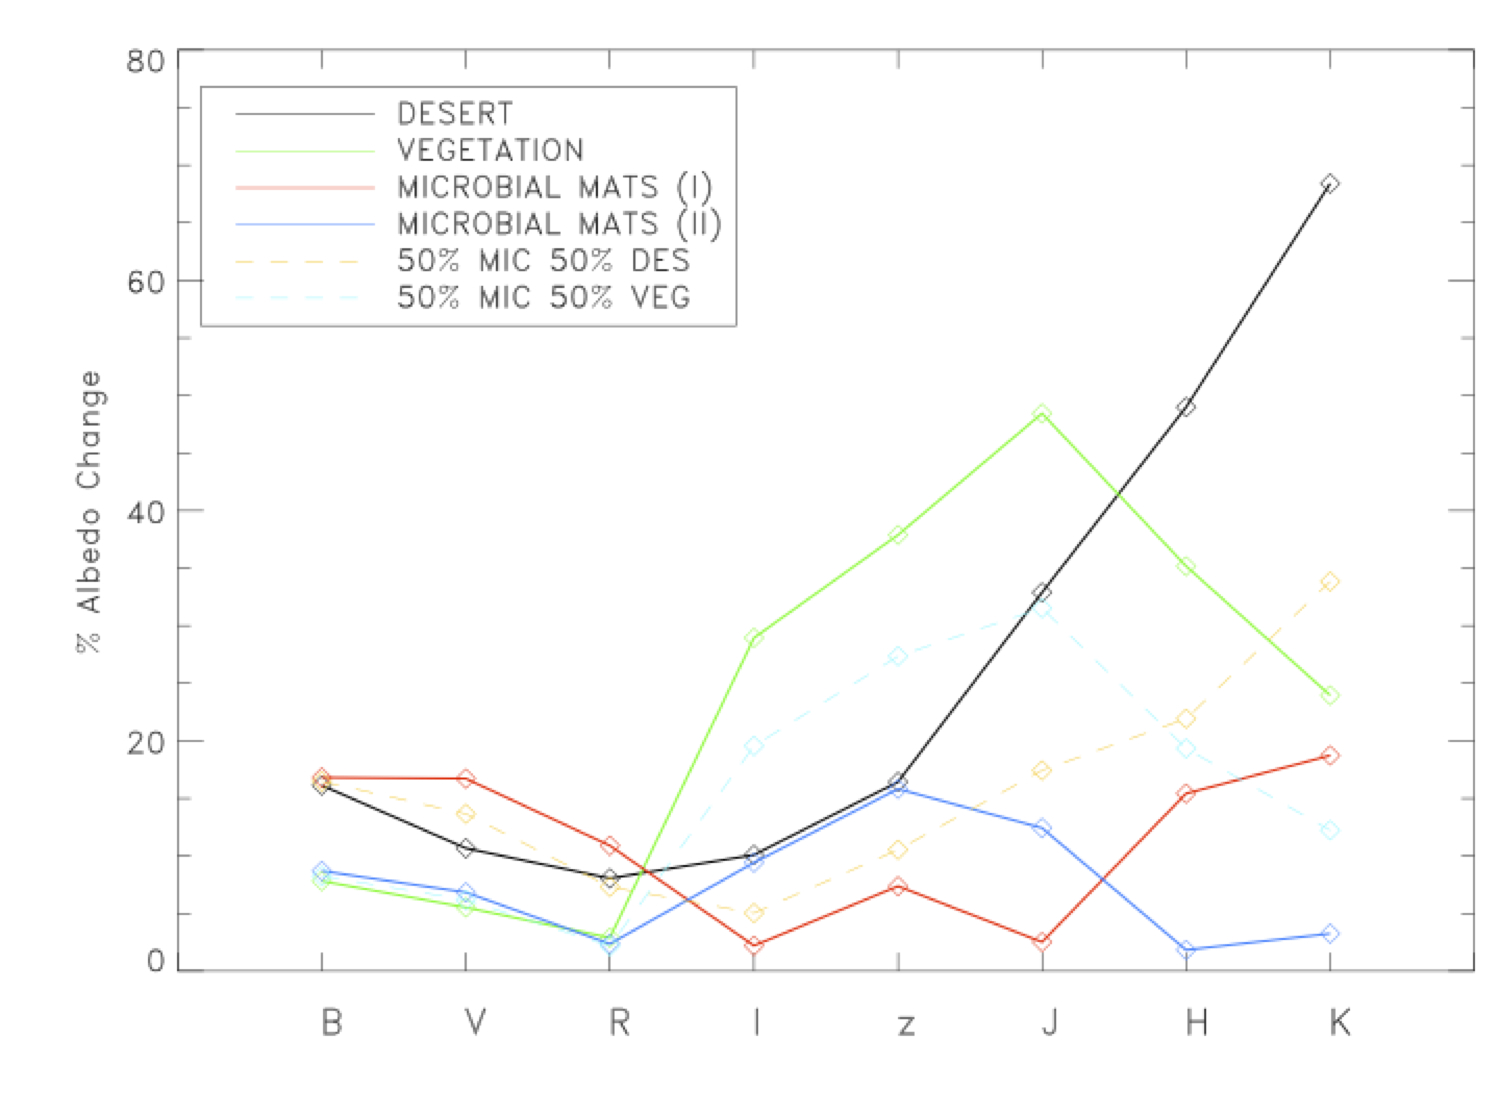
Figure 1: amplitude of variability in albedo (i.e., magnitude of variation in brightness) of the Earth 0.5 billion years ago as a function of broadband filter for different surficial compositions of the continents. The filters are arrayed from short wavelengths (left) to long wavelengths (right). The black curve represents the “desert” case in which the continents are composed of lifeless soil. The green case represents the “vegetative” case where the continents are entirely covered with forest. The blue and red lines represent continents covered by microbial mats, with the red line taking the microbial mat cloudiness model to be the same as desert cloudiness, while the blue line takes the microbial mat cloudiness to be the same as the “vegetative” case. The dashed light blue and yellow curves represent slightly more realistic cases where the surface is a mix: the light blue corresponds to a surface that is 50% microbial mats, 50% desert and the yellow to a surface that is 50% microbial mats, 50% forest.
Figure 1 shows the amplitude of daily variation in light received from the planet in different filters. The authors find that the different types of planetary surfaces exhibit distinct signatures. Desert surfaces exhibit daily variation that rises sharply with wavelength. Forest surfaces have their daily variability peak around the J filter. Microbial mat surfaces do not exhibit a dependence of their daily variability on wavelength. The intermediate, 50% microbial mat/50% desert or forest cases exhibit similar variations to their desert/forest components, but much more muted. Thus, by looking at daily variability in different broadband channels, we can constrain the composition of the planet surfaces, at least ruling out some cases.
The ingenuity of these scientists is remarkable: using daily variations in brightness, they show we can probe conditions on the surface! Thanks to the work of authors like these, we are laying the groundwork to meaningfully characterize the surfaces of tiny planets many lightyears away, using tools and techniques not too far from what we have available today! It is through innumerable steps forward like this that we will slowly build the cathedral of astrobiology, and finally be able to detect life on another world.