Title: Cosmography of the Local Universe
Authors: Helene M. Courtois, Daniel Pomarede, R. Brent Tully, Yehuda Hoffman, Denis Courtois
First Author’s Institution: University of Lyon, France
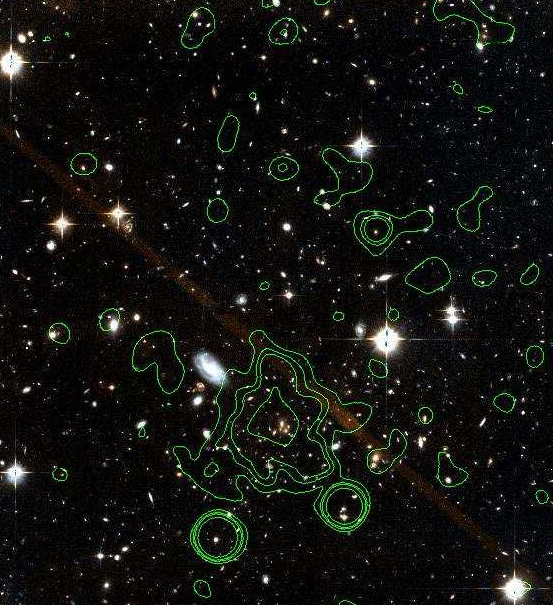
Fig 1. Large Scale Structure (aka: Universe in a Box) [credit: Univ. of Arizona]
Perhaps you have seen the images of the large-scale structure of the universe (or the so called “Universe in a Box”)—The clumping of galaxy clusters on the largest scale resemble something of a web (Fig. 1). These images are impressive, to say the least, but it’s pretty tough to get your bearings. The main result of this work is a beautiful video that presents the nearby Universe in three dimensions. The Milky Way is pointed out, distinctive features are labeled, and the camera is panned or zoomed in a fluid way so that you can keep your orientation straight and really get a feel for the environment that surrounds the Milky Way. The paper describes some of what is shown in the video and I will review some of that in the remainder of this post, but I highly recommend that you watch the video before continuing on to the rest of this post.
The video can be found in standard and high definition here: https://vimeo.com/64868713
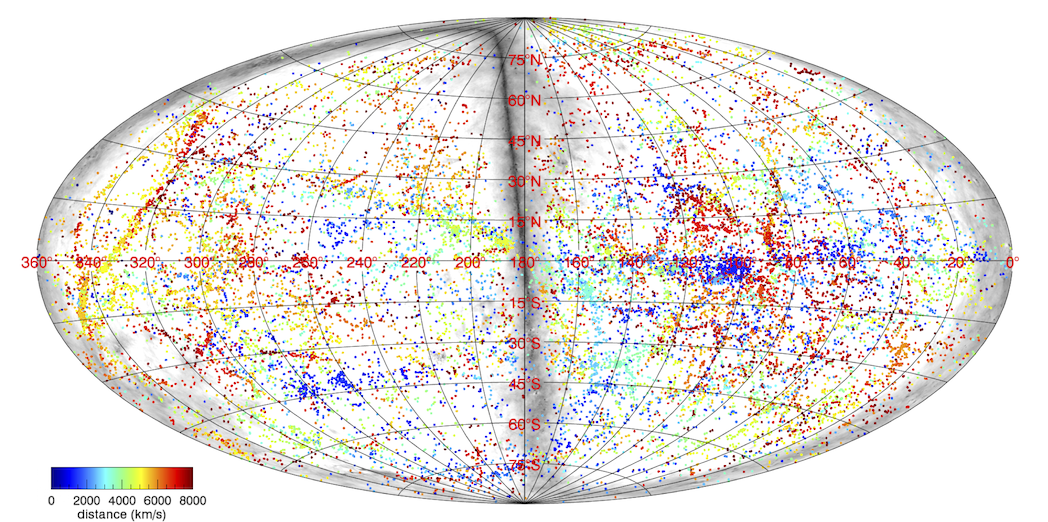
Fig 2. All sky map of the v8k catalog. All galaxies are within 8,000 km/s of Earth.
The cosmological tour begins with an “all-sky” map from the v8k catalog. The catalog contains redshift information for thousands of galaxies. Hubble’s Law tells us that the Universe is expanding. Everything around us is moving away from us, and the farther away something is, the faster it is moving away from us. This relationship has the effect of making a velocity a direct measure of a distance, so all of the maps in this study are in “redshift space“. That is, they measure distance in km/s. Fig. 2. maps many of the galaxies within 8,000 km/s (118 Mpc) from Earth. There are some filament-like structures that can be seen in the map as well as some clumping of galaxies in some areas.
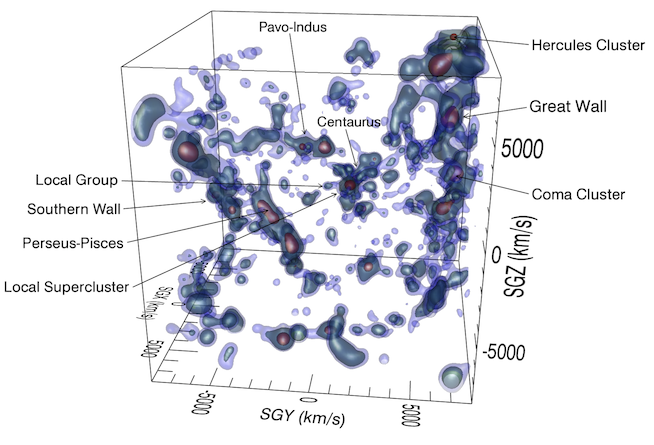
Fig 3. Density contours show a clumpy structure connected by filaments
But this just gives you an idea of where galaxies are. It doesn’t contain any information about how large or small each galaxy is. To get a better understanding of the distribution of matter, the authors used galaxy luminosities as a measure of their mass. The brighter the galaxy, the more massive it is. Unfortunately, this method becomes less efficient for more distant galaxies. Many low luminosity galaxies are lost at high redshifts. The authors do not go into much detail about it, but there is an established way to correct for this and infer the details of the missing galaxies. The authors use this information to plot density contours in redshift space, providing a way to visualize how nearby mass is distributed.
There are few structures of interest in this density map (Fig. 3). First is the Local Group. That’s us, along with just over 50 other nearby galaxies. If clumps of galaxies are cities, then the nearest metropolitan center to us is the Centaurus Cluster. There are hundreds of galaxies within the cluster, and it is the region of convergence for five filaments. The authors point out that the term “filament” is very loosely defined, since morphologies can vary quite a lot, but they’re essentially the long strings of density that connect the major galaxy clusters together.
Another prominent feature is the so-called “Great Wall.” At over 500 million lightyears long, 300 million lightyears wide, and 16 million lightyears thick, it is one of the largest structures in the Universe that we know of. It may even be much larger than that, but the gas and dust from the plane of the Milky Way obscures our vision and we don’t know exactly how far the Great Wall extends.
Finally, the authors examine the “peculiar velocities” of nearby galaxy clusters. As I mentioned before, the farther away a galaxy is from us, the faster it is moving away from us. However, some galaxies aren’t moving away at the velocity we’d expect. Some are moving away faster than they should, and some are moving away slower. This deviation in velocity from that predicted by Hubble’s Law is the peculiar velocity. For many galaxies within 3,300 km/s from Earth, distances can be measured directly and their true line-of-sight velocity can be calculated. From this the authors constructed velocity field maps that illustrate the large-scale flow of nearby galaxy clusters.
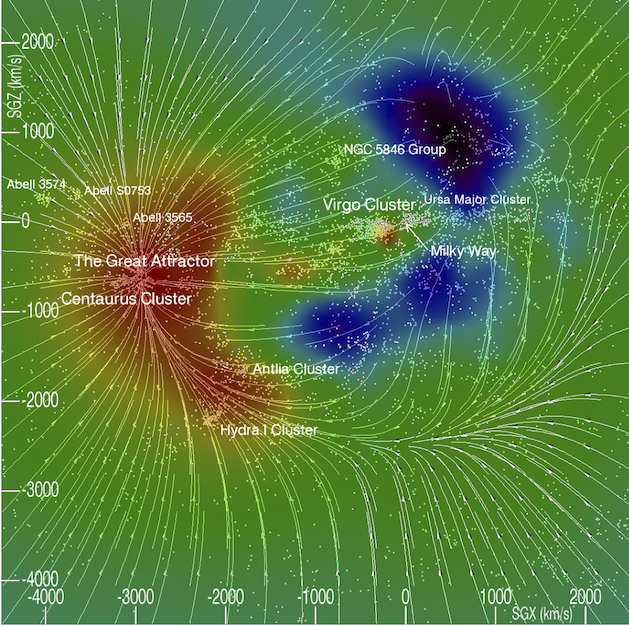
Fig 4. Peculiar velocity field. The color represents the density of the vector field.
The Centaurus Cluster again steals the show (Fig. 4) here; it’s appropriately nicknamed “The Great Attractor.” The Milky Way is labeled in the diagram. Galaxies near us tend to be heading towards the Virgo Cluster and ultimately towards the Centaurus Cluster.
The combination of these images—which, again, are even more impressive animated—can help provide us with a deeper, more intuitive understanding of our local Cosmos. After all, like the Earth and the Solar System and The Milky Way, this is what we call home.

Trackbacks/Pingbacks