Title: On the formation time scale of massive cluster ellipticals based on deep near-IR spectroscopy at z~2
Authors: Masayuki Tanaka, Sune Toft, Danilo Marchesini, Andrew Zirm, Carlos De Breuck, Tadayuki Kodama, Yusei Koyama, Jaron Kurk, Ichi Tanaka
First Author’s Institution: National Astronomical Observatory of Japan, Osawa
Galaxy Formation
Galaxies are expected to form early in the history of the universe from smaller collections of stars. Understanding how they formed is currently an open question in astrophysics, and a hot topic of research. We have some hints, though: a certain class of galaxies, called elliptical or early-type galaxies, appear to have some very regular properties wherever they are found, and very old, red populations of stars, without many new stars being formed. For these and other reasons, we think that they must have formed very early in the history of the universe, in short-lived bursts of star formation.
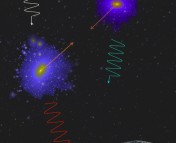
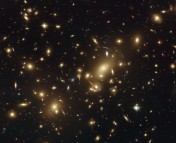
When we look at the distribution of galaxies in the sky, we also notice that they seem to clump together into galaxy clusters. These observations lead us to a picture of structure formation that suggests smaller objects in the very early universe (dwarf galaxies and protogalaxies) gradually fell together and merged to create the larger structures that we see today (galaxies and galaxy clusters). As galaxy clusters are among the largest objects in the universe, they must have formed more recently than other, smaller structures. This also means that if we look far enough out into the universe, we expect that beyond a certain point we will see no galaxy clusters: this is because the light that is travelling to us from those distances is old enough that it came from a time before clusters could form.
This point is expected to be roughly around redshift 2. Recall that cosmological redshift, a result of the expansion of the universe, means that more distant objects are more redshifted; it is common to use redshift as a rough proxy for distance when we’re looking this far out, where it is extremely difficult to get accurate distance measurements.
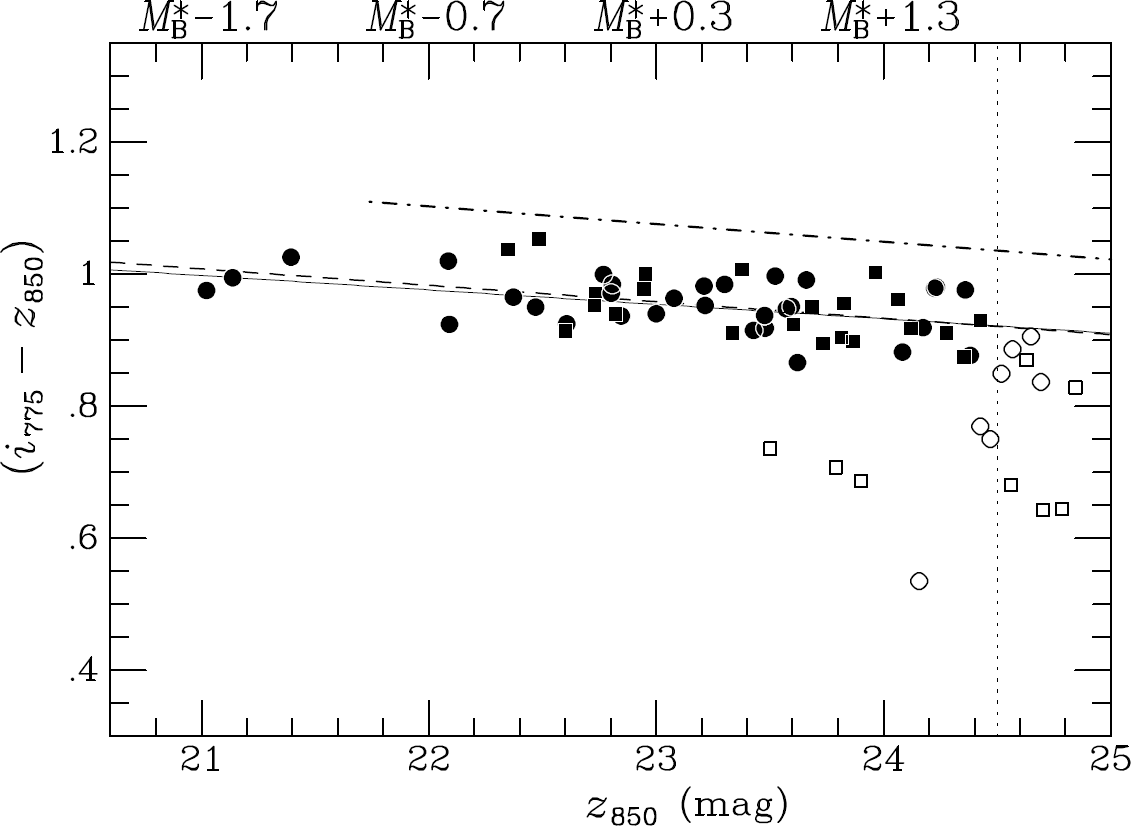
Example of a red sequence from an evolved cluster (RDCS 1252.9-2927) shown here as an example. Redder galaxies (higher on the plot) are brighter (more leftward on the plot) in a very tight relationship. From Blakeslee 2003.
However, at redshift 2 and higher, we can find the smaller protoclusters which are in the act of growing into the mature clusters we see in the local universe as galaxies and gas fall into their gravitational well. By studying protoclusters we can learn about how clusters form, as well as how galaxies themselves form. This paper describes the study of a protocluster detected at redshift 2.16.
In clusters today, elliptical galaxies exhibit a further interesting relationship: the redder the galaxy is, the brighter (and more massive) it is, in a relationship known as the galactic red sequence. This relationship is remarkably consistent, linear, and present in every cluster we’ve seen, even out to redshift 1.6! Understanding how such a regularity can form in clusters could potentially be a major step toward understanding how the galaxies themselves formed. To that end, we might wonder if we can see such a “red sequence” in protoclusters like the one in this paper.

Example of a model SED being fit to the data. The red points are the observed fluxes from one galaxy, while the black / grey line is the spectrum of a model galaxy. You can see a good agreement with the model. From Figure 3 in the text.
Galaxy Modeling
To get a handle on the properties of the galaxies in this protocluster, the researchers compare them with detailed model galaxies. In this method, one builds up the full spectra (the “Spectral Energy Distribution”, or SED) of a great many model galaxies out of the spectra of populations of stars, allowing the stars to age as new stars form, arriving at a collection of many thousands of different model galaxies of different ages, masses, and histories. You can then see which model spectra most closely matches the spectrum of the galaxy you’re observing, and infer its properties (age, mass, etc.) from the model. This might sound incredible, but it actually works quite well!
The authors sampled the protocluster galaxies’ light in everything from ultraviolet to infrared filters, in addition to taking visible spectra for the 11 galaxies in their protocluster. Altogether this gives them plenty of data to fit to the SED models and allows them to determine accurate ages for these galaxies, which allows them to see when and how these galaxies formed.
Results
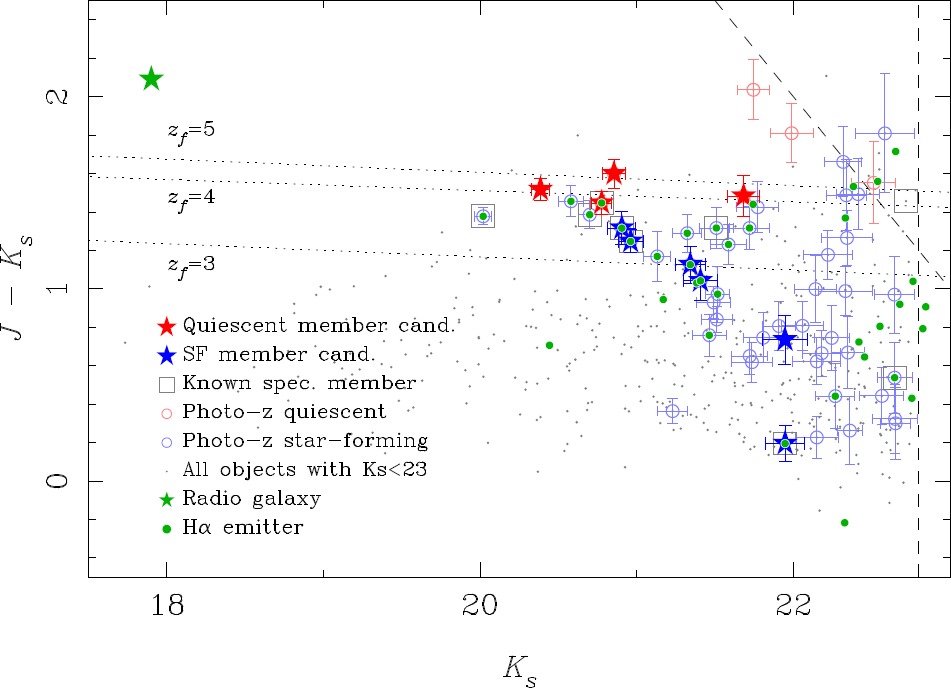
The color-magnitude diagram for the protocluster, roughly showing the redder (higher up) galaxies to be brighter (more leftward). This appears to be the beginning of a red sequence. From Figure 8 in the text.
The red sequence – the statement that the redder a galaxy is, the brighter it is – is indeed seen in the galaxies in this protocluster, but it’s weak and seems to be in the process of forming. Together with the estimated ages of the galaxies, this supports the hypothesis that these early-type galaxies formed in about half a billion years, roughly a billion years after the big bang. This is also the first confirmed observation of a red sequence in a protocluster. Altogether these results provide a wealth of information about the formation of the oldest galaxies which I don’t have the space to touch on here.