Paper Title: Tracing Mass and Light in the Universe: Where is the Dark Matter?
Authors: Neta Bahcall and Andrea Kulier
Institution: Princeton University
Delving into the Dark
Dark matter — an invisible substance that we think forms the scaffolding of galaxies and galaxy clusters — seems to comprise about 80% of the matter in the Universe, while luminous baryons — everything we can actually see — accounts for the other 20%. How well does light trace dark matter? Is there a higher proportion of dark matter in larger systems? New results from Bahcall and Kulier using weak lensing measurements suggest that stars and dark matter are remarkably coincident at all scales beyond the influence of a galaxy cluster’s massive central galaxy. This means that there is no additional dark matter in clusters beyond that in the galaxies that comprise them.
Tracing Mass and Light
This study employs an impressive sample of 132,473 galaxy clusters — the most massive gravitationally bound structures in the Universe — from the Sloan Digital Sky Survey (SDSS) catalog. The clusters span a range of redshifts from 0.1 to 0.3, and vary greatly in cluster richness (i.e. density of galaxies). The authors measure how both light and mass vary within clusters as a function of distance from the cluster center. For each cluster, the center was defined to be the location of the Brightest Cluster Galaxy (BCG), which is the most massive, luminous galaxy that lies in the heart of the cluster’s gravitational potential. The mass density
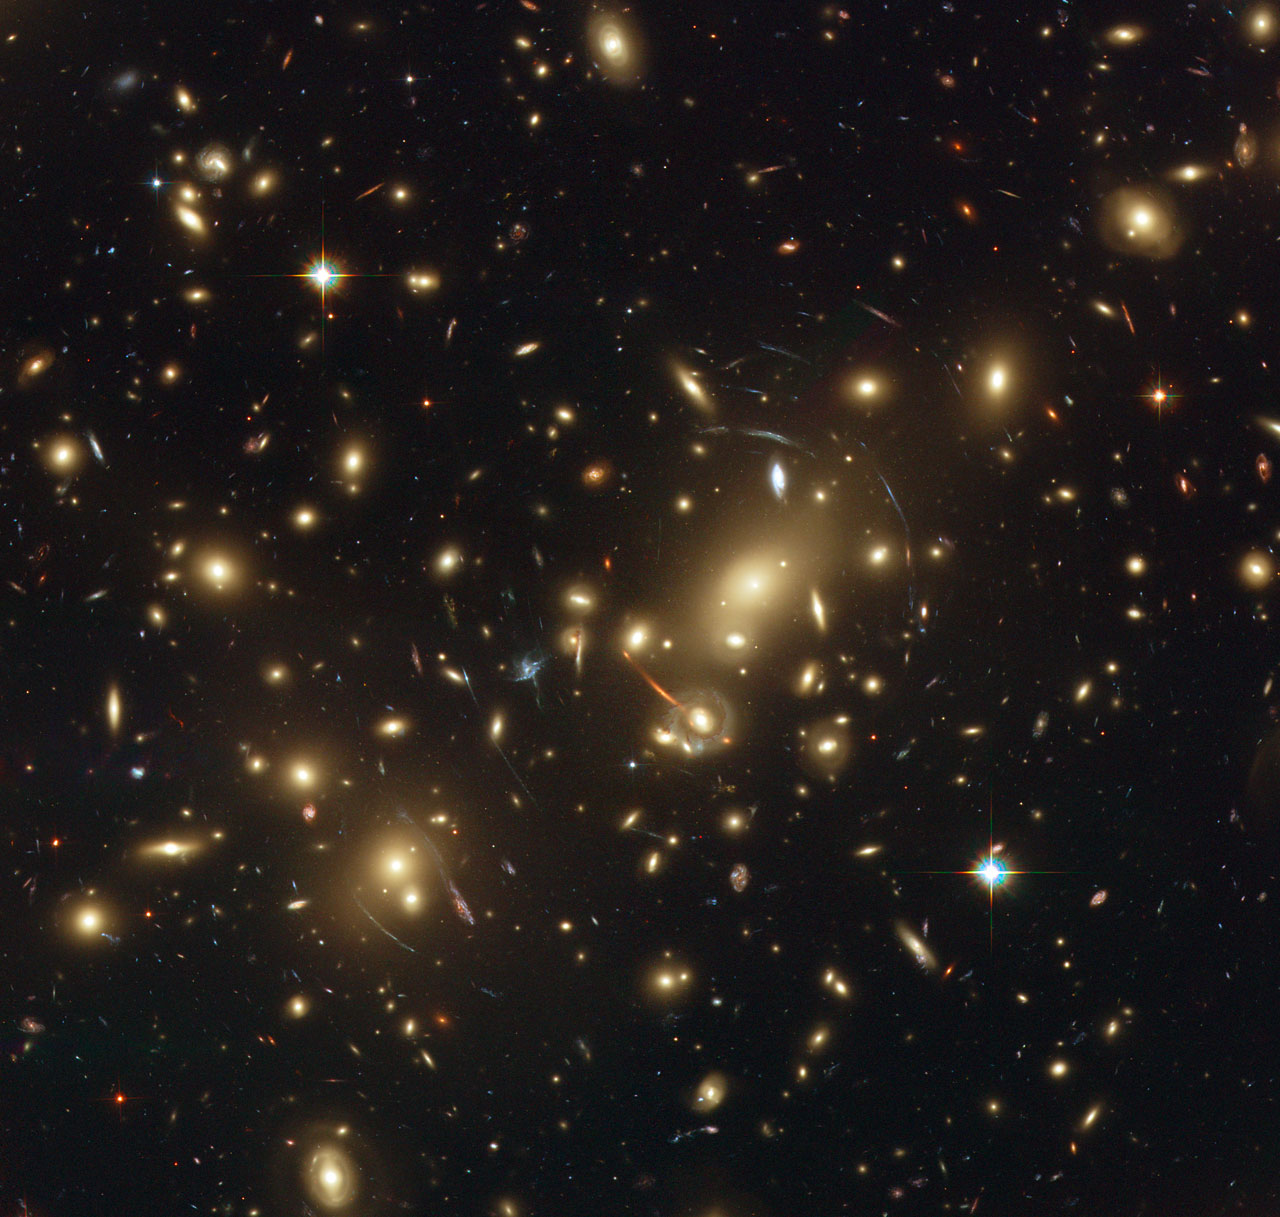
Figure 1: The rich galaxy cluster Abell 2218. Many background galaxies have distorted shapes due to lensing, and the mass of the cluster can be inferred by measuring these distortions. The circular pattern in this image is lensing.
profiles were derived from weak gravitational lensing measurements, which use the visible distortions of multiple background galaxies caused by the gravitational lensing of their light by the galaxy cluster (see these astrobites for more on the miracles of weak lensing). Luminosities of the galaxies within and near these clusters were measured by the SDSS. These were then used to calculate galaxy cluster light profiles by adding up galaxy luminosities in radial bins, starting at the cluster center.
Since the goal of this work was to compute average mass density and luminosity profiles for galaxy clusters, the above procedure was not performed on individual clusters. Instead, clusters of similar richness were centered on their BCG and stacked, and the lensing and luminosity measurements conducted on the entire stack, which comprised anywhere from 50 to thousands of clusters. While this removed the ability to derive properties for any single cluster, it greatly improved the sensitivity and reduced the systematic errors, allowing mass and light measurements out to more than 20 Mpc — much larger than the clusters themselves. Clusters were divided by richness into 3 groups for measurement and analysis: “poor” (3-8 galaxies), “intermediate” (9-25 galaxies), and “rich” (more than 25 galaxies). The authors then compute the cumulative mass-to-light radial profile, M/L (< r), for each richness group by dividing the average mass profile by the average luminosity profile.
The Mass-to-light Ratio in Clusters
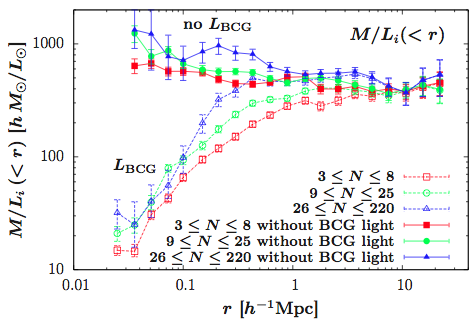
Figure 2: Mass-to-light ratio of galaxy clusters as a function of distance from the cluster center. The solid lines exclude the light from the cluster’s Brightest Cluster Galaxy (BCG), while the dotted lines includes the BCG.
Figure 2 (at right) shows that, excluding the light from the BCG (solid lines), M/L decreases only slightly over the full range in distance from cluster center r probed. However if the BCG is included (dotted lines), M/L does increase sharply with r in the central few 100s of kpc. This is a direct reflection of the BCGs’ individual mass-to-light ratios — these monster galaxies are extremely luminous in their centers. These results seem to hold for both rich and poor galaxy clusters, although the increase in M/L is slower in poor clusters where the BCG is even more dominant.
The authors explain the slight decrease in M/L (r) seen above as follows. At small r, excluding the BCG’s light but not its mass leads to an overestimate of M/L. At large r, there are progressively more spiral galaxies than elliptical galaxies (the so-called “density-morphology” relation in galaxy clusters). Spirals have active star formation, and thus young stars, which contribute a large amount of luminosity for their mass (recall that 
No Need for Extra Dark Matter in Clusters
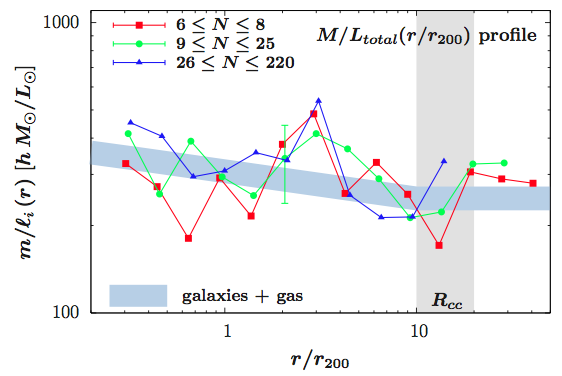
Figure 3: Mass-to-light ratio as a function of distance from the cluster center in galaxy clusters, with the Brightest Cluster Galaxy excluded. The blue band shows the expected contribution from galaxies and from the intracluster gas.
Figure 3 (at right) shows that the mass-to-light ratio in galaxy clusters (excluding the contribution from the BCG) is relatively constant, decreasing only slightly as a function of distance from the cluster center. In this figure the distance is normalized by r200, the radius at which the local density is 200 times the average density of the Universe. This removes any effects that might be a result of differing cluster sizes. The authors show that the decrease in M/L can be explained by the change in mass-to-light ratio of the galaxies presumably making up these clusters, as shown by the blue bar. This suggests that all that’s needed to account for the dark matter content of galaxy clusters is the sum of the dark matter of the galaxies that comprise them. There appears to be no extra dark matter in clusters between the galaxies.
The results of this paper suggest that light traces mass on all scales above about 300 kpc, regardless of environment. The measured value of this constant mass-to-light ratio can be converted into a derived mass density parameter, a dimensionless number that represents the density of matter with respect to the critical density needed to “close” the Universe. The authors find