Yesterday, we began a discussion of the “Modern Statistical and Computational Methods for Analysis of Kepler Data” at the Statistical and Applied Mathematical Sciences Institute in Research Triangle Park, North Carolina. Let’s continue today with some more thoughts of the conference, including an astronomer (hey, that’s me!) and a statistician. For a reminder, here’s part one.
Kepler‘s noise: Ben Montet
Kepler is far and away the most sensitive instrument we have for detecting small decreases in a star’s observed light due to a planet transit. These transits are not the only variations in the Kepler data. By looking at the raw data returned by Kepler (see below) one can easily detect other effects such as starspots rotating across the stellar surface, the star moving to a more or less sensitive point on the detector, and small breaks in the data as the telescope turns towards Earth to beam its results back home every month. To search for the small, Earth-sized planets hidden in the data, we want to eliminate this astrophysical and instrumental noise without destroying the signal from the planets. This is a hard problem! If the signal is affected, we might measure the incorrect radius for the planet; in the worst cases we might miss a planet entirely. Unfortunately, planet signals can look a lot like instrumental artifacts or vice versa, and automated pipelines sometimes confuse the two.
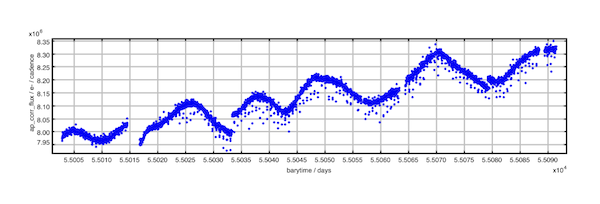
An example of a Kepler light curve. The very short, periodic dips correspond to a transiting planet. The periodicity on a timescale of weeks corresponds to the stellar rotation, as starspots rotate in and our of our field of view. The short breaks in the data occur when the telescope turns towards Earth to beam back its data.
After working in a group with statisticians and astronomers, we decided the answer to this problem might reside in a signal processing technique: wavelets. A wavelet is a oscillation in a signal that has wave-like properties but is confined to a small region: it only takes nonzero values inside of a certain range. Sounds like a transit signal! There are various types of wavelets for various applications. We tested a Haar wavelet, which is optimal to search for tophat shaped signals, a reasonable approximation to a planet transit. To compare the performance of a wavelet approach to other approaches, we injected fake companions into real Kepler data. In these cases, we knew exactly how big the planets we were looking for were, so we would know how accurately we could determine the planet parameters. We then tested various detrending and search techniques to find what systems could find the planets we had injected, and once they were found, how accurately they measured the size of the planets. We only had three weeks, but our wavelet methods showed serious promise in improving the planet detection efficiency over other current methods! We’re still working on this program now that we’re all back at our respective institutions, and are planning a reunion at the upcoming Kepler Science Conference at the NASA Ames Research Center.
The Statistician’s Perspective: Jessi Cisewski
As of this posting, the entirety of the astrostatistics Wikipedia page is the following: “Astrostatistics is a discipline which spans astrophysics, statistical analysis and data mining. It is used to process the vast amount of data produced by automated scanning of the cosmos.” I would like to expand on this, if I may. First, I would say “astrostatistics” encompasses all of astronomy (not just astrophysics!), all of statistics (I have a goal to find an area of statistics that can’t be applied to astronomy. I haven’t succeeded.), and machine learning. The second and final sentence of the Wikipedia page leads the reader into thinking that somehow things are cut and dry—automated, almost. (I admit I may be reading more into that sentence than I should.) At least to me, “astrostatistics” is best done as a collaboration between astronomers and statisticians. This was certainly embodied in the SAMSI Kepler workshop. For those three weeks, we laughed, we cried, we had meetings, worked on projects, and even took the occasional frisbee break (to my best recollection, no one actually cried). After breaking through a few interdisciplinary language barriers (“When you say `observation’, what exactly do you mean?”), we were able to initiate a number of projects that were both scientifically and statistically interesting. We have continued to meet over the subsequent months and it seems that fruitful collaborations have formed. I must say, to all statisticians reading this, astronomers are some of the best people around with whom to work. They have many (and I mean MANY) extremely interesting statistical problems, and they just seem to be all-around enjoyable people. [ed. note: this is true!] I am looking forward to continuing my collaborations including at a follow-up meeting this summer at Carnegie Mellon.
That’s it! This conference was really enjoyable, and far different from a typical astronomy conference. Each working group collaboration is continuing to work together, and at least a few publications are likely to result from this conference. I really enjoyed my time at SAMSI, and am looking forward to the follow-up meeting this summer at Carnegie Mellon, Interdisciplinary conferences such as this are a great opportunity to break out of your comfort zone and learn about a subfield you may not think about on a daily basis. If you have the opportunity to attend a conference such as this in your field, I highly recommend it!
Jessi Cisewski is a visiting assistant professor in the department of statistics at Carnegie Mellon University.
SAMSI is a partnership of Duke University, N.C. State University, UNC-Chapel Hill, and the National Institute of Statistical Sciences, in collaboration with the William R. Kenan, Jr. Institute for Engineering, Technology, and Science. For more info, check out samsi.info.