Title: Properties of galaxies reproduced by a hydrodynamic simulation
Author: M. Vogelsberger, S. Genel, V. Springel, P. Torrey, D. Sijacki, D. Xu, G. F. Snyder, S. Bird, D. Nelson, L. Hernquist
Author’s institution: Dept. of Phys., Kavli Institute for Astrophysics and Space Research, Massachusetts Institute of Technology, Cambridge, MA
Status: Published in Nature
As computers have become bigger and better over the past half century, Astronomers have increasingly relied upon computer simulations to tackle problems with no analytic solution. Computational astrophysics has become an essential tool used to test our understanding of the physics that controls our Universe, and to make predictions based upon what we already know. It is strange to think that just 70 years ago a “numerical” simulation performed to study stellar systems consisted of placing a series of light bulbs on a table as stand-ins for massive objects (i.e. the stars) and their gravitational interaction (light received by each other) was measured by photometers. A time-step in the “simulation” involved moving the light bulbs, measuring the light received, and repeating; essentially painstakingly integrating by hand the gravitational interactions between these stars. Less than a single generation later, Astronomers now use supercomputers to simulate a host of astrophysical phenomena, from the intricate details of star and planet formation, to the evolution of entire swaths of the Universe.
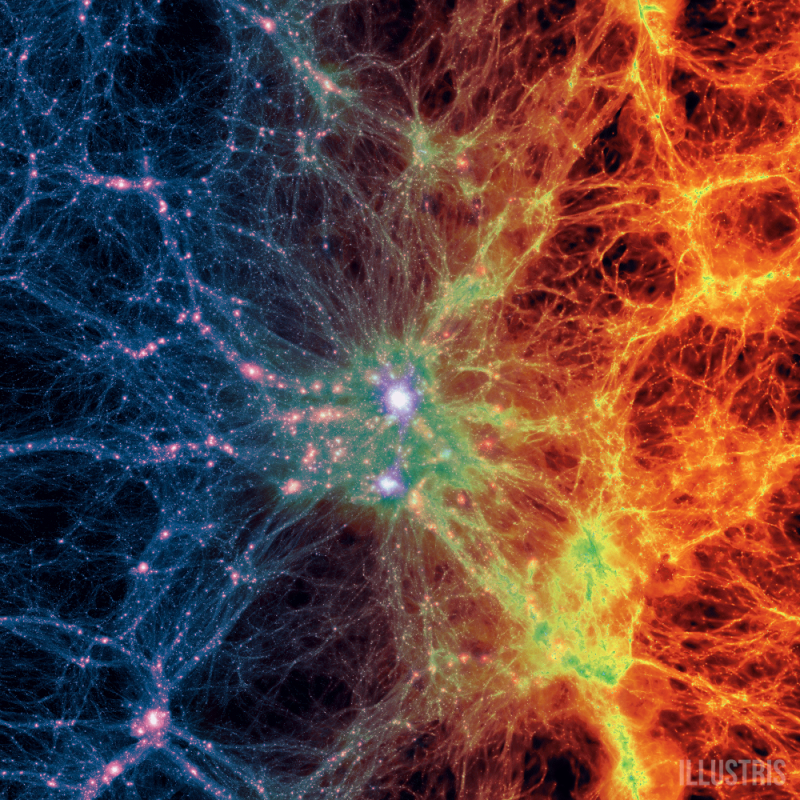
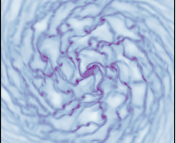
Fig.1 A snapshot of the Illustris simulation at z = 0. At the center is the most massive galaxy cluster in the simulation, with dark matter density shown on left, and gas density on right. (Source)
Today’s Astrobite covers a special development in Astronomy. Just this past week, the authors released their first of many publications on the highest resolution, cosmological simulation made to date: Illustris. Before we dive into some of the details, I want to make sure to impress upon you just how high resolution is obtained in this simulation. Starting 12 million years after the Big Bang, the authors construct a box containing both dark matter and gas that is 106.5 Mpc on a side (for scale, our Milky Way is roughly 30 kpc long, and a galaxy cluster has a radius of 1 to a few Mpc). The simulation uses a type of moving mesh code by which resolution is increased / decreased as needed, which is often correlated with gas or dark matter density at a given point in the simulation. By present day (a redshift of z=0), their simulation box reaches a highest grid resolution of 48 pc. Comparing this to the box size, this is a dynamic range of over one million!!! Fig. 1 shows a snapshot of a portion of their simulation at z = 0. This allows them to resolve the evolution of 41,416 individual galaxies. This allows for some truly spectacular images, whereby their simulated galaxies look eerily similar to real galaxies (see Fig. 2). In total, running this entire simulation on a single processor would take 19 million hours.
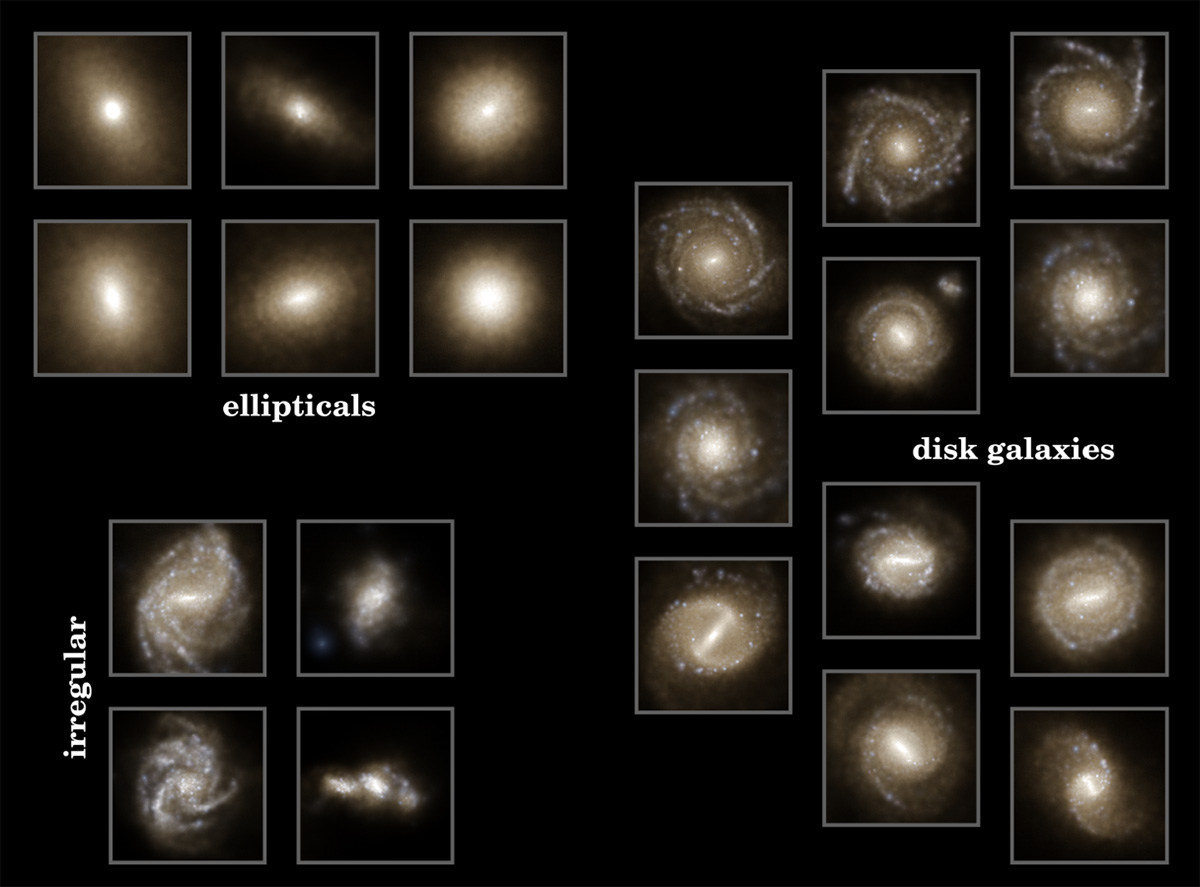
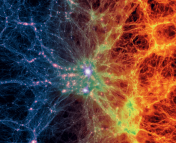
Fig 2: A selection of galaxies from the Illustris simulation. Shown are examples of elliptical, irregular, and disk galaxies. In each image, stellar light is shown, with blue denoting star forming regions. (Source: Fig. 1a in Vogelsberger et. al. 2014 )
A Recipe for the Universe
Ok, so Illustris didn’t really create something from nothing, a lot of work was involved in supplying all of the appropriate physics needed to reproduce the Universe we observe as best as possible. Doing this perfectly, however, is a problem that has (and will continue) to plague computational astrophysics for a long time. The fact is, no matter how high resolution of a simulation you produce, there will always be important physics that occurs below the resolution of your simulation; these processes are referred to as “sub-grid” physics. For example, stellar formation is an essential part of our Universe (it is how we have elements other than Hydrogen and Helium), but in cosmological simulations, this occurs far below the highest resolution possible (in fact, sub-grid issues are present even when simulating the formation of a single star). Even more important, are processes relating to feedback, where, generally, gas is expelled from systems. This occurs in galaxies through what is called the “galactic wind“, driven by explosions and outflows from AGN and supernova. A primary motivation for high resolution simulations like Illustris is to reduce the amount of important physics that occurs below the maximum resolution.
Illustris was performed with a hydrodynamic code called AREPO. This code is grid based, and adaptive in that it can change resolution as needed, but does so in an unstructured way to produce unusual looking grid cells (i.e. not cubes). The authors constructed Illustris with the purpose of simulating a large volume of the Universe to very high resolution, while including models for galaxy formation that handle: star formation, supermassive black hole formation, winds driven by supernova and AGN, and radiation effects from these extreme phenomena.
Solving Problems, one Universe at a Time
Although simulations do a very good job of reproducing and explaining much of what we observe in the Universe, there is much that they are terrible at reproducing. It is not clear that this failure is due to a fundamental misunderstanding of important processes in our Universe, or simply insufficient resolution in simulations, which must rely on imperfect “sub-grid” models. The authors of this paper argue that, in at least a few key situations, many outstanding disagreements between theory and observation are solely due to insufficient numerical resolution. They do this by demonstrating that the Illustris simulation is able to succeed where many previous simulations have failed. I will outline a couple key examples below:
The missing satellites problem
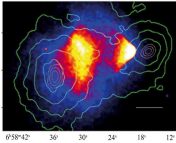
For a long while, simulations have been unable to reproduce the observed radial distribution of satellite galaxies within galaxy clusters. Previous models and simulations would either overestimate the number of galaxies in the central regions of clusters, or be unable to reproduce the correct shape of the radial profile. In Fig. 3, the authors plot the projected galaxy number density for massive galaxy clusters in their simulation (black line with colored dots) as a function of distance from the cluster center. r500,crit is commonly used to indicate the size of a galaxy cluster, giving the point from the cluster center at which the density in the cluster is 500 times the critical density of the universe. The dot colors indicate the color of the galaxies (red at cluster center, or non-star forming; blue at cluster outskirts, or star forming). This is compared to clusters from the SDSS survey shown in green. The dashed line gives this same result compared to a dark matter only Illustris simulation. This dashed line suggests that the inability to reproduce this trend in previous dark matter only simulations was because baryon physics plays an essential role in structure formation in our universe. This great step towards a resolution to the missing satellites problem shows that the underlying physics that produces the distribution requires simulating both dark matter and baryons in unison, and doing so at high resolution.
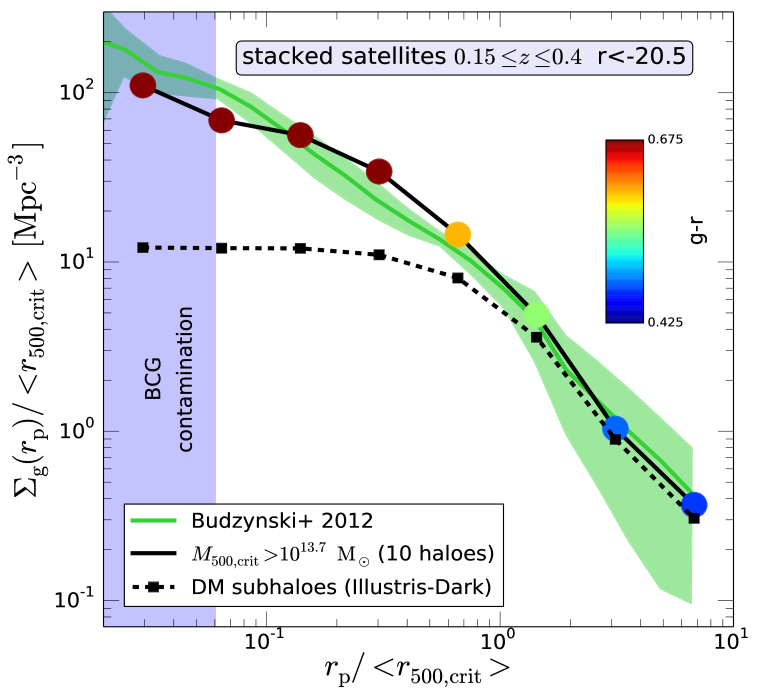
Fig 3. The projected surface density of satellite galaxies in galaxy clusters for the Illustris simulation (solid black line) compared to SDSS galaxy clusters (green) as a function of projected distance from cluster center. The colored dots show the average colors of galaxies at a given distance. The dashed line shows this same result for a dark matter only simulation. (Source: Fig. 2 in Vogelsberger et. al. 2014)
Distribution of neutral hydrogen in the Universe
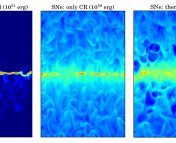
A reliable and accurate way to study the presence of neutral hydrogen (HI) in the Universe is through Lyman-alpha absorption by hydrogen of background light. Most often, this background “light” source is a quasar, and one looks for dips in the quasar brightness at the Lyman alpha line to indicate the presence of hydrogen. This observation produces a measurement of hydrogen column density (density integrated along the line of sight). Its distribution at high column densities is well known. The authors confirm that their simulation reproduces the expected distribution function (points) of HI column density (NHI) in the left side of Fig. 4 (black line) at a redshift of z = 3. The remarkable new development here is given on the right side of Fig. 4, where the authors show that Illustris is able to capture the observed probability distribution of the metallicity (amount of elements that are not hydrogen or helium) of these systems between z = 2 and z = 4; this has been challenging to do until now. Their result is shown in black, compared to observation (points).
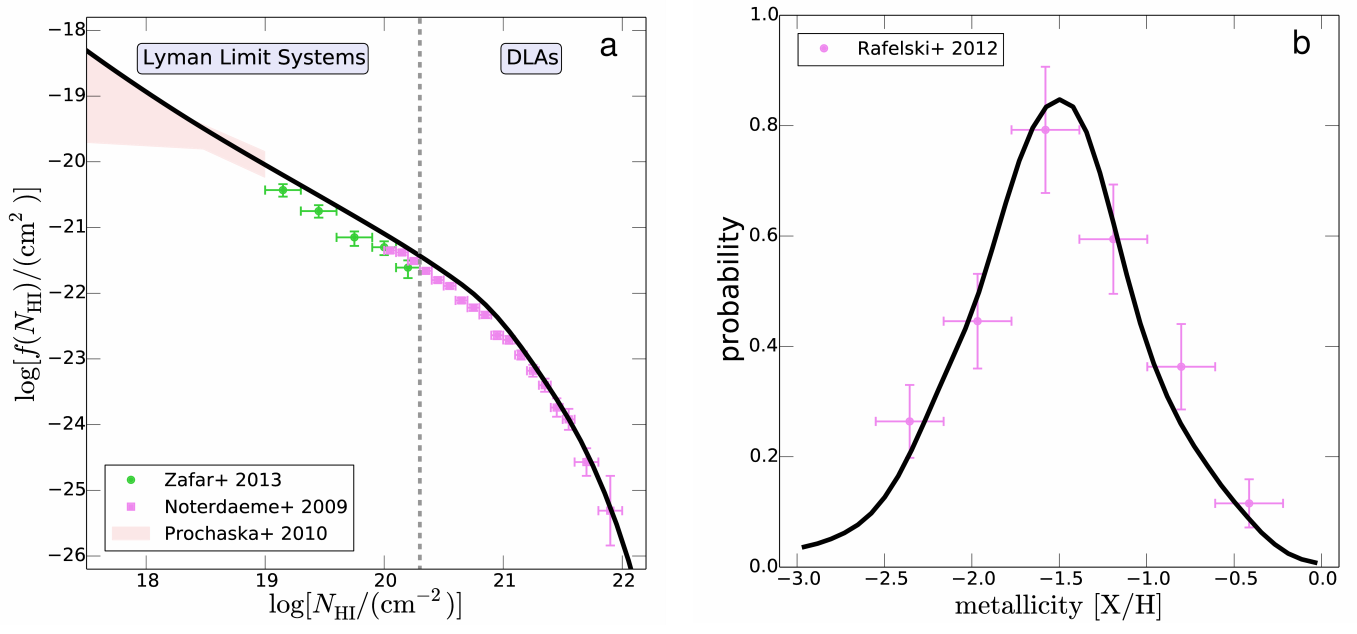
Fig. 4: Neutral Hydrogen column density distribution function (left) at z = 3 for Illustris (black line) compared to observation (points). The right shows the probability distribution of metallicites for these systems at z = 2 to z = 4 from Illustris (black) compared to observation (points). (Source: Fig. 4 in Vogelsberger et. al. 2014)
Astronomy at Your Fingertips
Besides the exciting implications for Astronomy, Illustris is a special endeavor. The authors have the goal of making the simulation data easily accessible and explorable by anyone, be it other Astronomers or the general public. I encourage you to check out and explore their beautiful website. They have many amazing images and videos, and even allow you to fly through a snapshot of their simulation (I’ve spent way too much time doing this already). We at Astrobites are excited to be able to share an exclusive interview with the designer of this amazing website. Look for this post tomorrow!!!
Trackbacks/Pingbacks