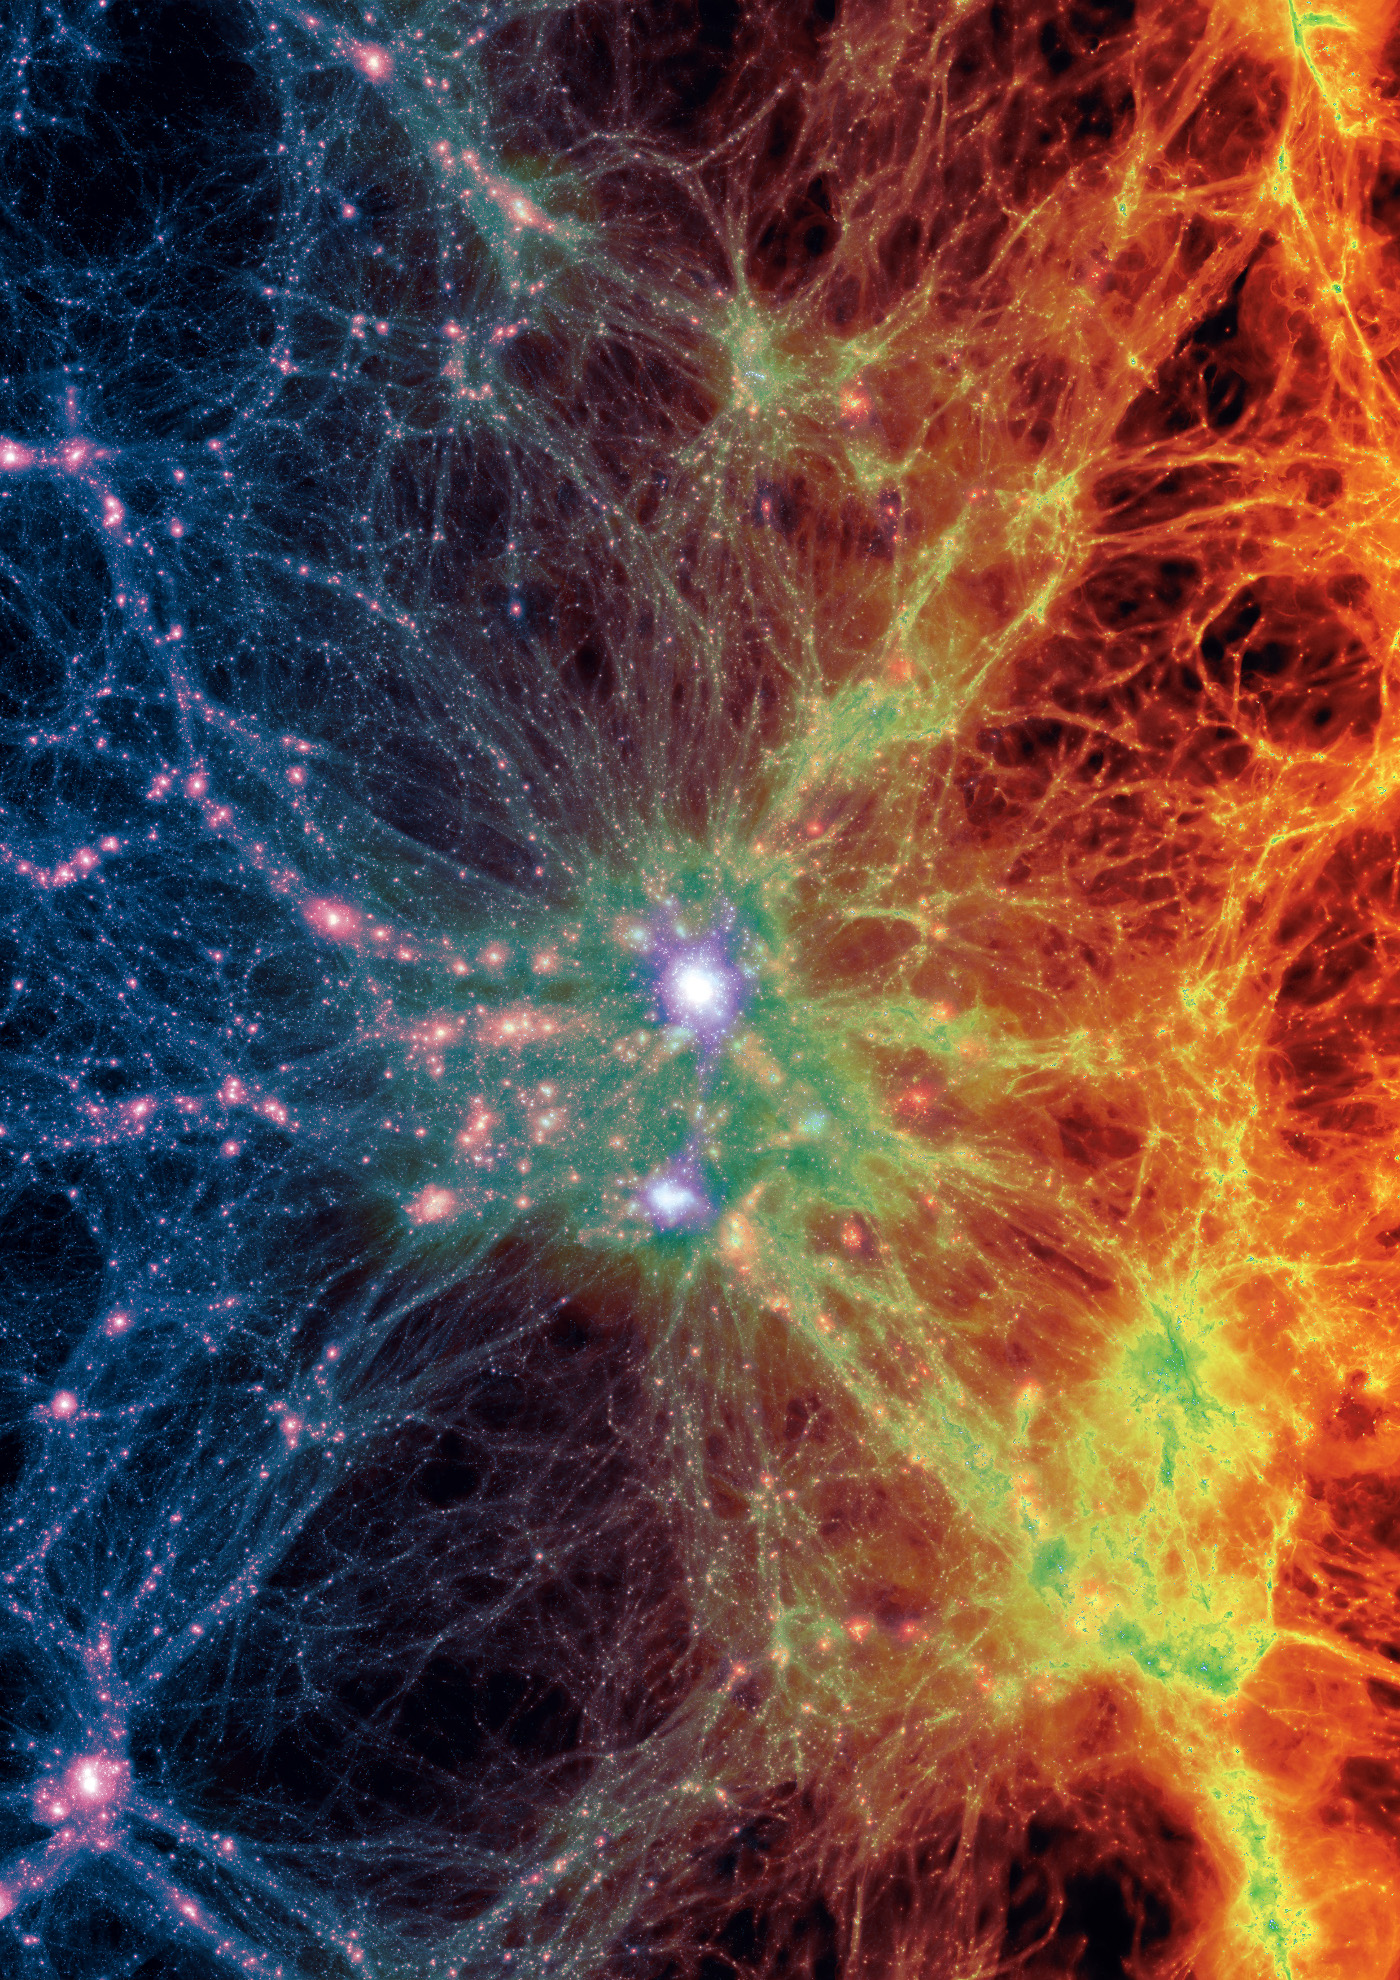
Visualization of the Illustris simulation showing the contrast between the dark matter (left) and gas (right) density in the simulation. Similar views can be made on the Illustris Explorer website.

Harvard Astronomy graduate student Dylan Nelson, architect of the Illustris Project website.
Remarkably, there is a new website where you can pan and zoom around a universe, as if Google Maps had exquisite data on the density, temperature, and chemical composition of matter throughout space for a hundred million light years. The site is made possible by the results from the Illustris project we wrote about yesterday. Illustris is a cosmological simulation of truly epic proportions: 10 billion resolution elements, a volume of more than a million Mpc3, and 19 million CPU hours of computing time.
The Illustris website is an exceptional public presence for a scientific project, in a field where the standard practice for releasing scientific research results doesn’t go much further than posting a preprint to the arXiv. When a public release of a large simulation output or observational dataset is made at all, it’s often simply posted as a tarball on an ftp site. This approach puts a substantial burden on other scientists to download, integrate, and interpret the data in order to build on it for their own work. Expansive and functional interactive tools for exploring or querying large astronomical datasets have been constructed only rarely in the past, as for the Millenium Run and SDSS, typically requiring significant new software development and expense.
So my first thought after seeing the Illustris team’s slick website was, how did they build it? What team of elite Silicon Valley engineers or NSA hackers was cajoled to help this team of astronomers build such an impressive and useful site?
Illustris & the open science movement
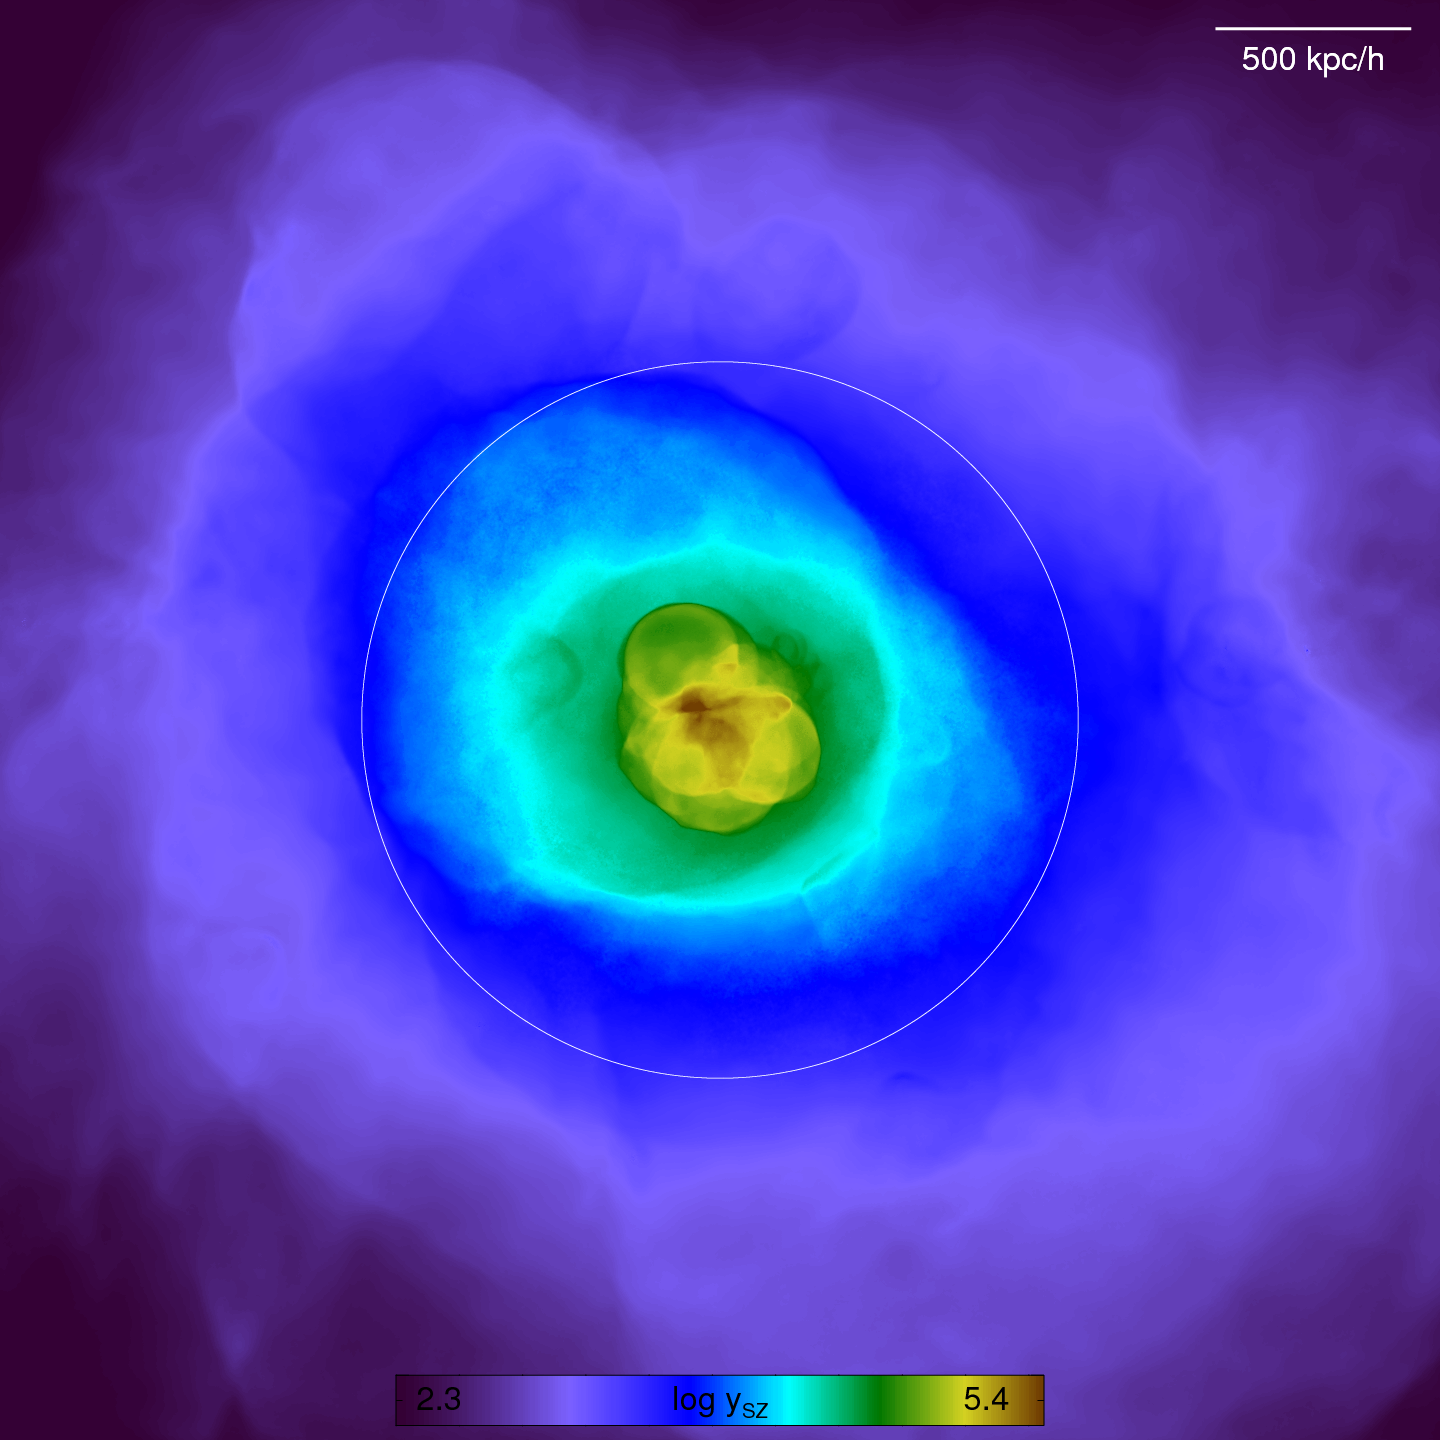
Visualization of the strength of the predicted Sunyaev–Zel’dovich effect strength around an AGN in the Illustris simulation volume.
It turns out that the interactive tools on the Illustris website are the labor primarily of one man, my fellow Harvard Astronomy graduate student Dylan Nelson, and the development was completed in only a couple months. Dylan credits the recent development and availability of open source web tools, like the javascript mapping library Leaflet that he used, as making it possible for him to build the site. These new tools empower astronomers to share their data and results with other scientists, and the public, in fundamentally new and exciting ways.
Dylan sees the offering of interactive tools like the ones he’s built as one component of a larger movement towards open science. Sharing the output and results of scientists’ work in a way that other can extract, visualize, and apply to their own research is a critical component of the movement. Going even further, to make science truly reproducible, scientists should share the analysis code and prescriptions they use to generate the figures in their paper, and the observational data reduction or simulation code that produced the data in the first place.
Dylan says that the Illustris project is interested in all these aspects of open science, but they necessarily have different timescales for execution. In upcoming versions of the Illustris website, the team hopes to make the full simulation data available and explorable through their interactive tools. The data explorer, which is now limited to a single slice of the simulation volume at redshift of 0 (i.e. the modern day universe), would be able to pull data from their ~100 TB simulation output to display the full volume at any time throughout the simulation. The numerical hydrodynamics code used to run the Illustris simulation, AREPO, will also be made publicly available in the future.
Sharing your research online
Dylan volunteered to take on the task of building the Illustris website. To do so, he relied on his past web development experience honed on projects including volume rendering visualizations of hydrodynamic simulations and 3D representations of Voronoi Tesellations that run in your browser. Dylan’s own research within the Illustris group focuses on tracing gas particles throughout cosmic time using Monte Carlo methods, so that we can use cosmological simulations to understand how gas accretes, cools, and forms galaxies within dark matter halos.
To young scientists looking to make an impact on the scientific community through interactive projects like the Illustris website, Dylan recommends experimenting and practicing as much as possible. As science is increasingly dependent on and powered by computational tools, it is increasingly important for students to learn to use those tools–not only to produce scientific results, but also to share those results effectively–in order to prepare for a career in research.
Dylan suggests practice applying tools like webGL and d3 to interesting projects within your domain of research so that you can deliver your results over the web, as well as in scientific publications. Like Dylan’s past projects, and the Harvard AY 201b projects that we previously discussed on Astrobites, these experiments can serve as valuable references and educational tools for others. And, when applied to significant data releases for scientific projects, your experience can help usher in a new era in astronomy where scientists can easily share data and make comparisons between projects.


Trackbacks/Pingbacks