- Title: Discovery of a new faint dwarf galaxy associated with NGC 253
- Authors: D. J. Sand, D. Crnojevic, J. Strader, E. Toloba, J.D. Simon, N. Caldwell, P. Guhathakurta, B. McLeod, A. C. Seth
- First author’s institution: Texas Tech University, Lubbock, USA
- Status: ApjL, in preparation.
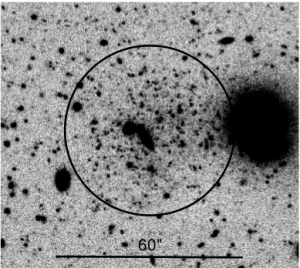
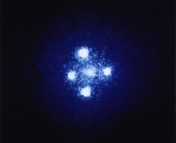
Figure 1. The g-band image of the dwarf galaxy (within the circle) found by Sand et al. near NGC253, which is not seen in this image. NGC 253 lies 65 kpc due North (in these coordinates, up). The images were taken with Megacam on the Magellan Clay telescope. Adapted from Figure 1 of Sand et al.
We know of the existence of several dozen dwarf galaxies, tiny islands of stars that are smaller and dimmer than spiral and elliptical galaxies. Most of the dwarfs we know are in our immediate neighbourhood, the Local Group. Is this because the Local Group is special, or can we find dwarfs in other environments? Our current model for cosmology, the LambdaCDM model, predicts that for each group or cluster of galaxies, there should be many small dark matter halos within it. These halos potentially host dwarf galaxies (many more than we observe!) but they have thus far been hard to find. This has been dubbed the “missing satellite problem“. The authors of this paper have discovered a new dwarf galaxy near a starburst galaxy.
The authors searched for dwarf galaxies around NGC 253, the brightest galaxy in the Sculptor group, within a radius of 150 kilo-parsec. Within this radius, our Milky Way has about a dozen of dwarf companions , including a handful of them in the shape of streams, currently being accreted by our Galaxy. The authors find an overdensity of stars near NGC 253, at a projected separation of 65 kpc, seen in Figure 1. The newly discovered dwarf galaxy gets its name after the Sculptor group and the instruments used to find it; it is named Scl-MM-Dw1. But is this a dwarf a companion to NGC 253, or is this a visual projection effect?
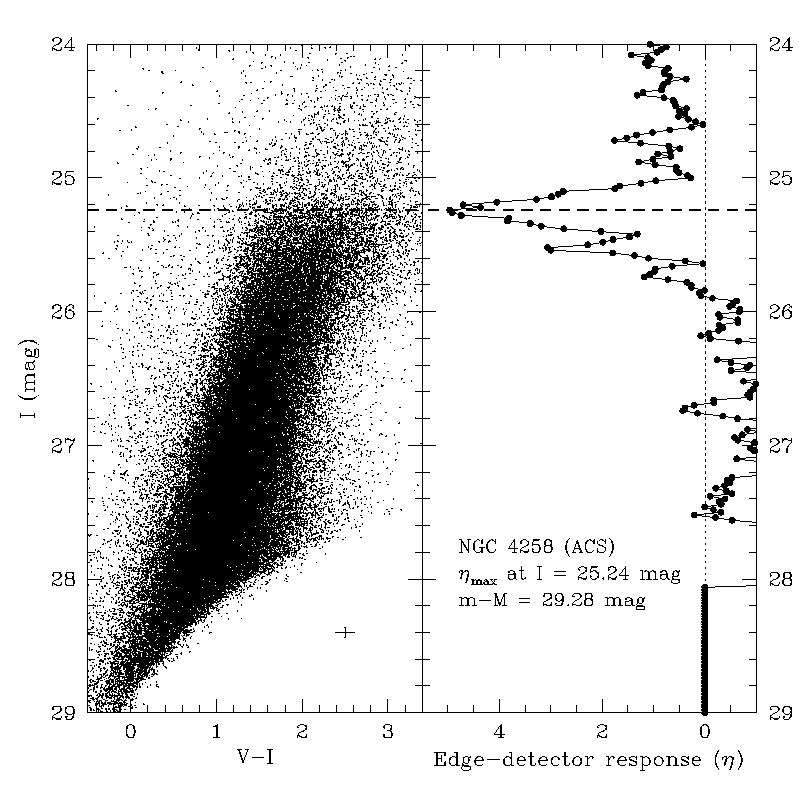
Figure 2. The CMD of NGC 4258, a spiral galaxy 7 Mpc away, is shown on the left panel. The blue points represents stars and there is a discontinuity in the abundance of bright red stars in the top right corner, which corresponds to the tip of the red giant branch. The panel on the right shows the result of filtering the data looking for this discontinuity. From Mager, Madore & Freedman (2008)
Observations were carried out in two optical wavelength bands, g and r. Imaging in these bands is crucial to determine the properties of a galaxy. The authors construct the color-magnitude diagram (CMD) of the stars. This is a plot of the apparent magnitude in one band versus the color of the stars (the difference of the apparent magnitudes in g and r). CMDs can be extremely useful for determining properties of the galaxy and its stellar population. The color in the x-axis represents the type of star, or its temperature. The magnitude in the y-axis is a proxy for the luminosity of stars, assuming they all lie at the same distance from us. In other words, the CMD is just another version of the Hertzsprung-Russel diagram. The brightest and reddest stars at the tip of the red giant branch (RGB) are old and reaching the end of their lives. There is a maximum luminosity that these stars can reach. For example, Figure 2 shows the CMD of the spiral galaxy NGC 4258. The tip of the RGB branch is located by filtering the data in the right panel. Comparing the apparent magnitude observed for the tip and the known maximum luminosity that can be reached, it is possible to estimate the distance to the dwarf galaxy.
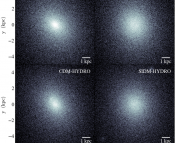
We reproduce the CMD of Scl-MM-Dw1 in the left panel of Figure 3. The other three panels show the colors of stars in random positions in the observed field. Using the CMD, the distance to the dwarf galaxy can be estimated at approximately 4 Mpc, which coincides with the distance to NGC 253. Once the distance to the galaxy is known, its luminosity can be estimated. Looking at the distribution of stars in the dwarf, the authors can also quantify some of the structural properties of the galaxy. It has a luminosity and size comparable to those of other dwarfs. They constrain the radius of Scl-MM-Dw1 to be ~340 pc. For comparison, the nearest star to the Sun is 1.3 pc away and the Milky Way has a radius of ~50 times that of this dwarf.
One of the interesting things about this dwarf is that it seems to have predominantly two type of stars, RGB and AGB. RGB stars are red and old, reminiscent of star formation that occured 10 Gyr ago. AGB stars, on the contrary, are young, dusty and luminous, and they were probably born less than 500 Myr ago. Given that the distance to the dwarf suggests it is physically associated with NGC 253, the authors point out that it is very uncommon for dwarf galaxies this close to a massive galaxy to have young stars. This is the first set of data on this new dwarf galaxy; future studies will shed more light into the nature of Scl-MM-Dw1.
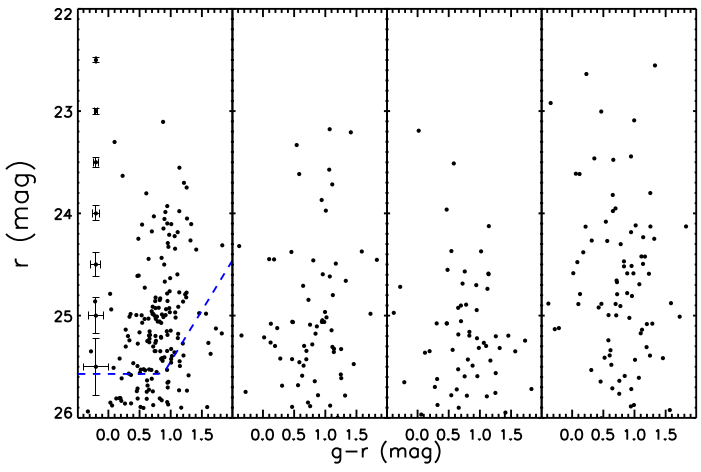
Figure 3. The color-magnitude diagram of the newly discovered dwarf is seen in the left panel. The y-axis gives the apparent magnitude (larger ir dimmer) and the x-axis gives the color (lower is bluer). Each point is a star in Scl-MM-Dw1 (left panel) or in a random field (right three panels). The typical error bars as a function of apparent magnitude are shown in the left panel. Below the blue dashed line, the observations are capturing less than 50% of the stars. Adapted from Figure 1 of Sand et al.