- Title: Biases and systematics in the observational derivation of galaxy properties: comparing different techniques on synthetic observations of simulated galaxies
- Authors: Giovanni Guidi, Cecilia Scannapieco, C. Jakob Walcher
- First Author’s Institution: Leibniz-Institute für Astrophysik Potsdam
- Paper Status: Submitted to MNRAS
Modern galaxy surveys, like the Sloan Digital Sky Survey, are revolutionizing our understanding of the universe we live in. These massive studies show us the huge variety in galaxy types and challenge our expectations for how they are supposed to look and behave.
To complement these large surveys, numerical simulations have been designed that attempt to replicate how galaxies grow and evolve. Simulators, like in this Astrobite, try to show how physical processes like gravity and star formation can combine to produce the galactic diversity we see from surveys. The results of these simulations are compared to real observations to tell if they have done a good job. When simulations don’t appear to match, they often suggest that other, unconsidered processes play an important role in forming galaxies. See, for example, the importance of supernova feedback in forming realistic galaxies.
Drawing Comparisons
The focus of today’s article is to examine one of the intermediate steps above: comparing simulated galaxies to observations. When simulated galaxies don’t appear to match the observations, it is often blamed on the simulations being incorrect. But simulations have the advantage that they are far easier to interpret. All the relevant properties, such as masses, sizes, and star formation rates, can be directly and precisely counted up. But deriving these properties from observations can be a difficult task: how, for example, do you derive the mass of a galaxy just from the light you receive?

Fig 1. A classic example of bias/systematic error: when trying to measure a value correctly (hit the bullseye), random error produces measurements widely dispersed, but centered around the correct result. Bias (or systematic error) leads to results not centered on the correct value, even though those results may themselves be close together.
Needless to say, observational astronomers have come up with brilliant ways of measuring the properties of galaxies. We’ll conveniently lump them together by the label of observational techniques. We won’t go into the details here, but they typically involve analysis of the colors and spectra of galaxies. The authors of today’s paper created simulated galaxies, for which the true properties are known. They then applied these observational techniques to compare the true answers to the values observers would expect to recover.
What the authors are looking for are sources of bias or systematic error. If observational techniques lead to biases, then the measured properties of galaxies will be off in one particular direction. For example, if the technique used to derive the sizes of galaxies had a bias low, then the sizes observers measure would always be lower than the true sizes. See Fig. 1 for an illustration. With the high-powered simulations available today, astronomers can now test whether observational techniques are biasing observed properties away from the true values.
The Simulations
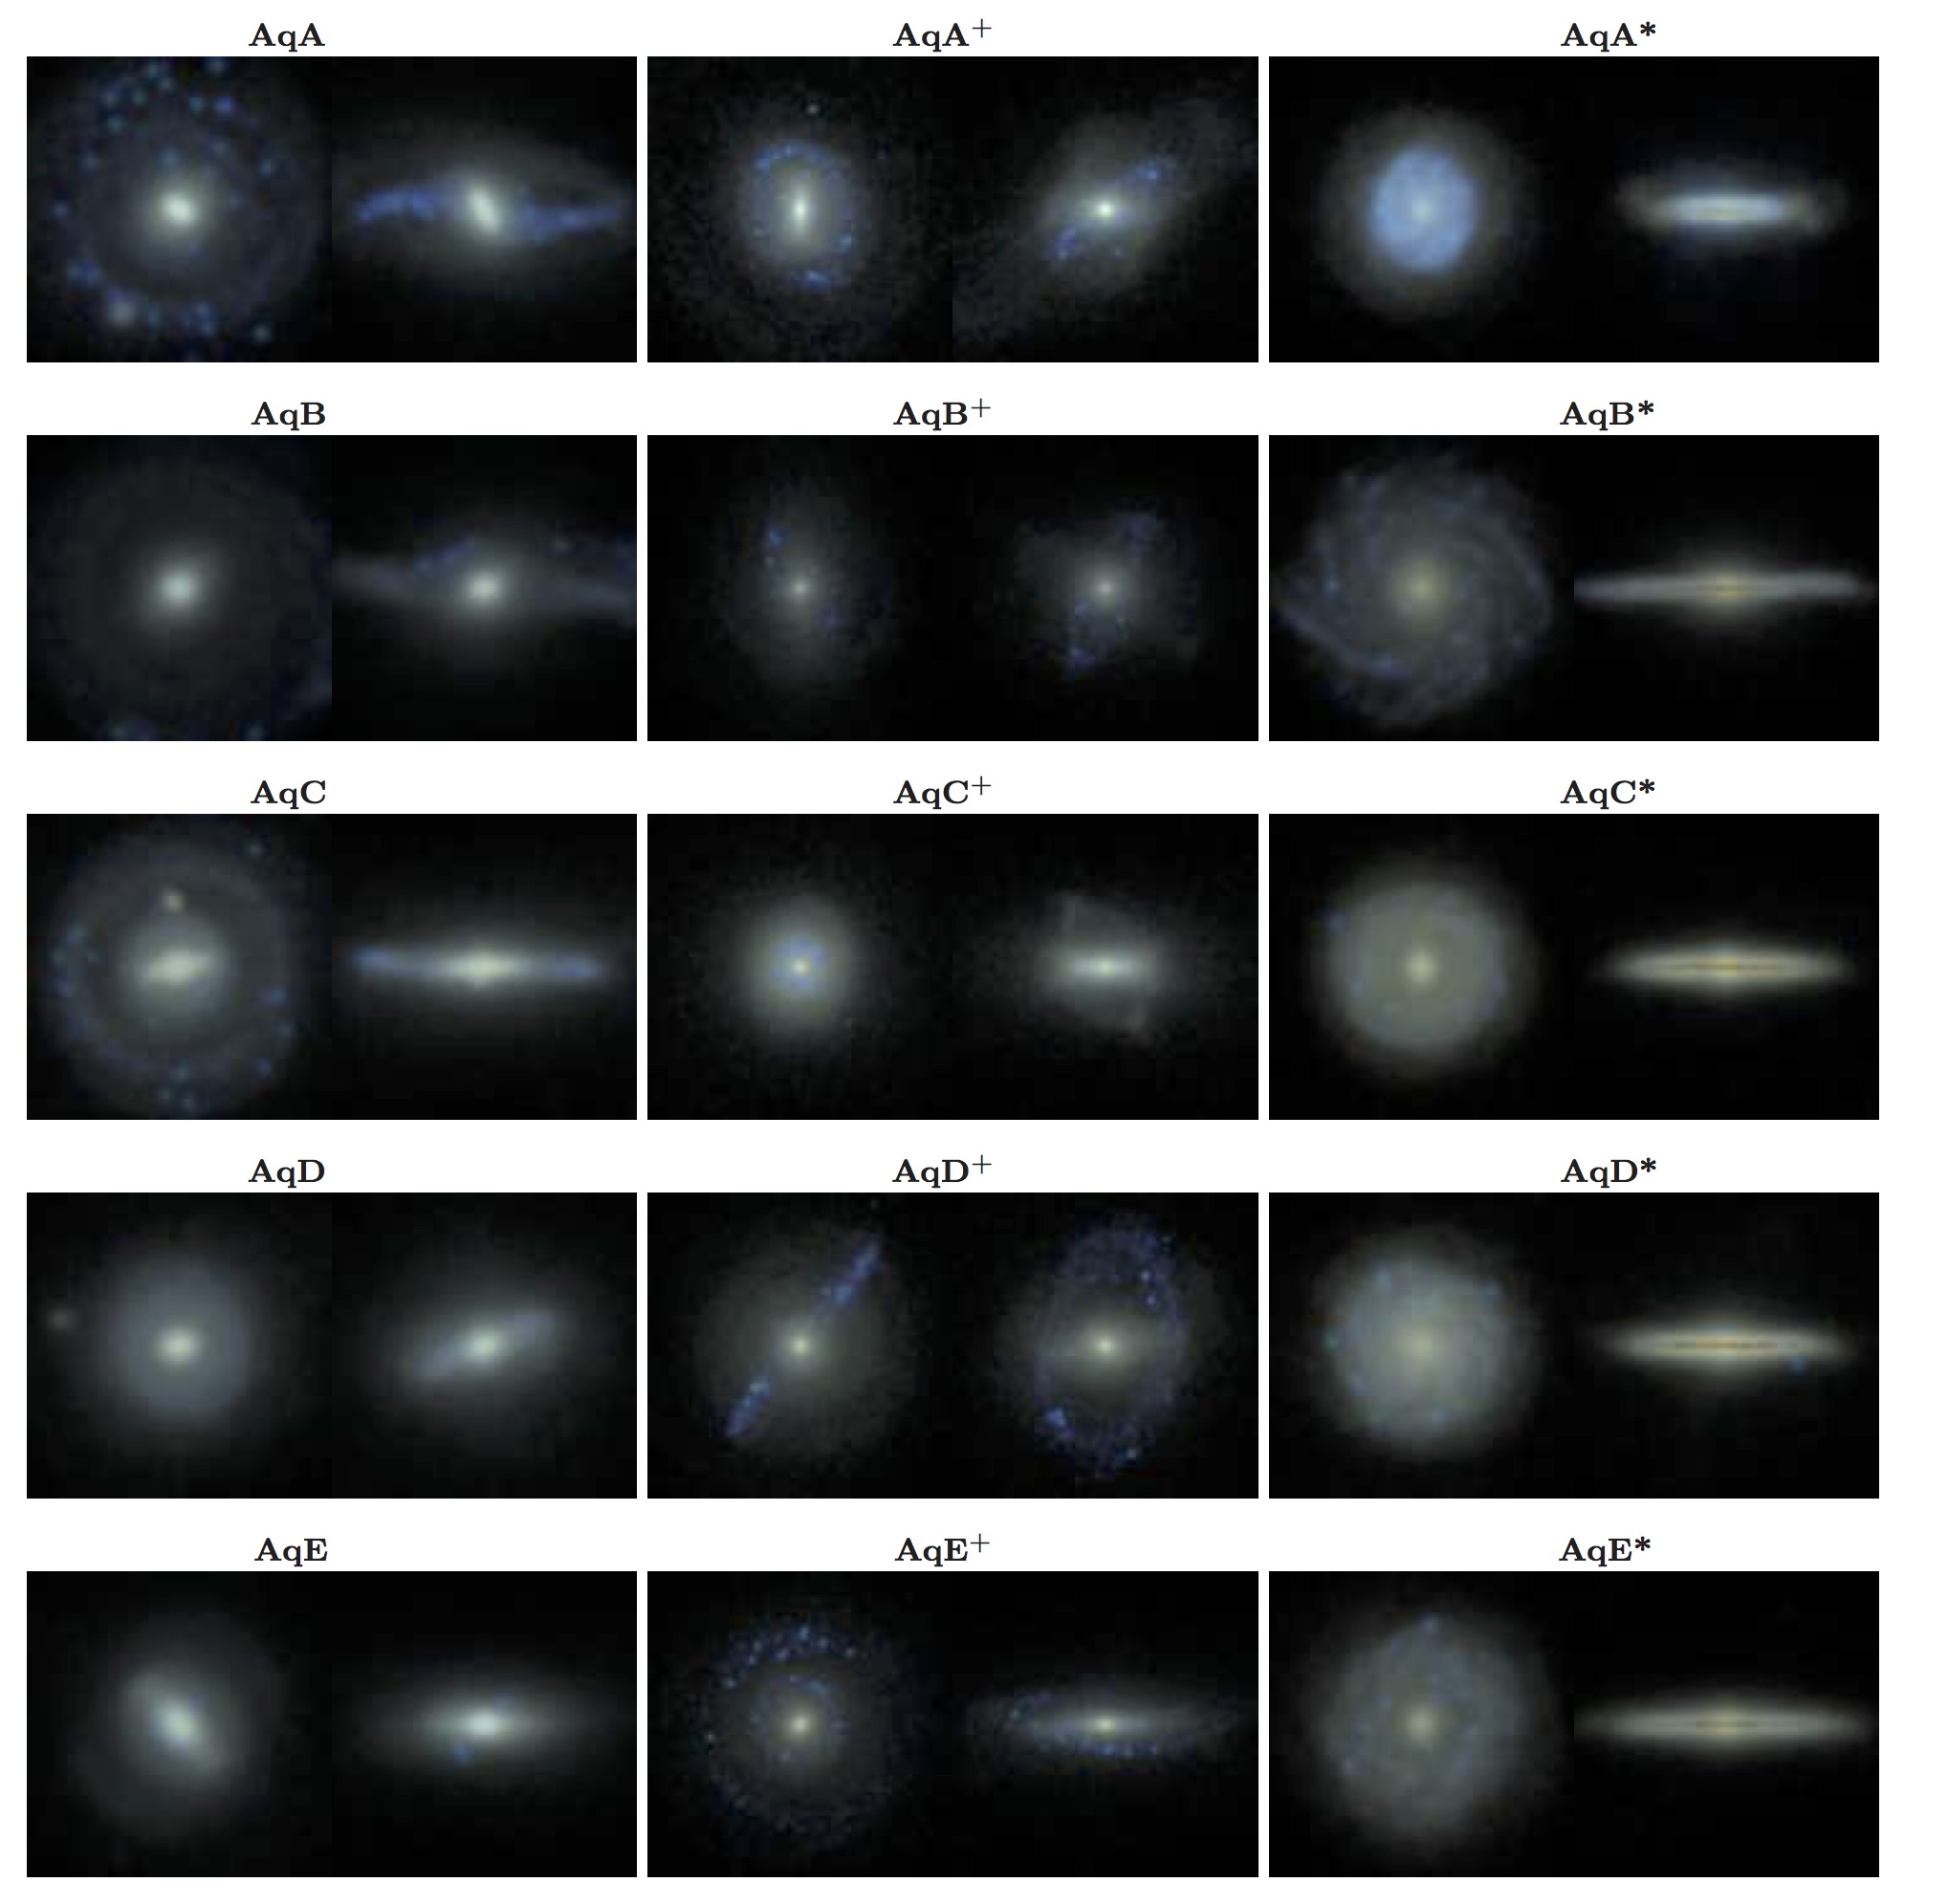
Fig. 2 – Post-processed images of the simulated galaxies. The colors are produced using model stellar light from each star particle. The three columns represent three different codes chosen to run the simulation. Figure 1 from Guidi et al. 2015
The authors used hydrodynamical codes to simulate the formation of five galaxies, similar in final mass and size to the Milky Way. Each galaxy has a unique formation history, however, based on the mergers and accretion they underwent. They also chose to run the simulation with three different codes, which use slightly different physical processes. This helps them check their results against different assumptions which went into creating the (15 total) galaxies. See Fig. 2 for the galaxy images.
In order to model “observing” the galaxies, each simulation had to be post-processed by assigning additional information to each particle. Originally, star particles have only physical properties such as mass, age, and metallicity, which must be turned into luminosities and spectra. Since computers can’t yet trace billions of particles for each star in a real galaxy, the star particles are much more massive (10^5 times) than a typical star. Therefore the post-processing requires a model for how many stars, and of what masses, would be represented in this large a bundle. This is known as a stellar population synthesis (SPS) model, since it is synthesizing an entire population of stars.
With an SPS model in hand, each star particle can be assigned a model spectrum, based on the ages and metallicity of all the stars represented by the particle. By combining these spectra, and applying various levels of dust extinction, the authors produce simulated spectra for the entire galaxy. The galaxies are now ready to be “observed”!
Do You See What I See?
Some of the most important properties the authors wished to “observe” were average stellar age and stellar metallicity, both of which can be directly calculated from the simulation. However, significant differences were found between the true values and those which would be derived using observational techniques.
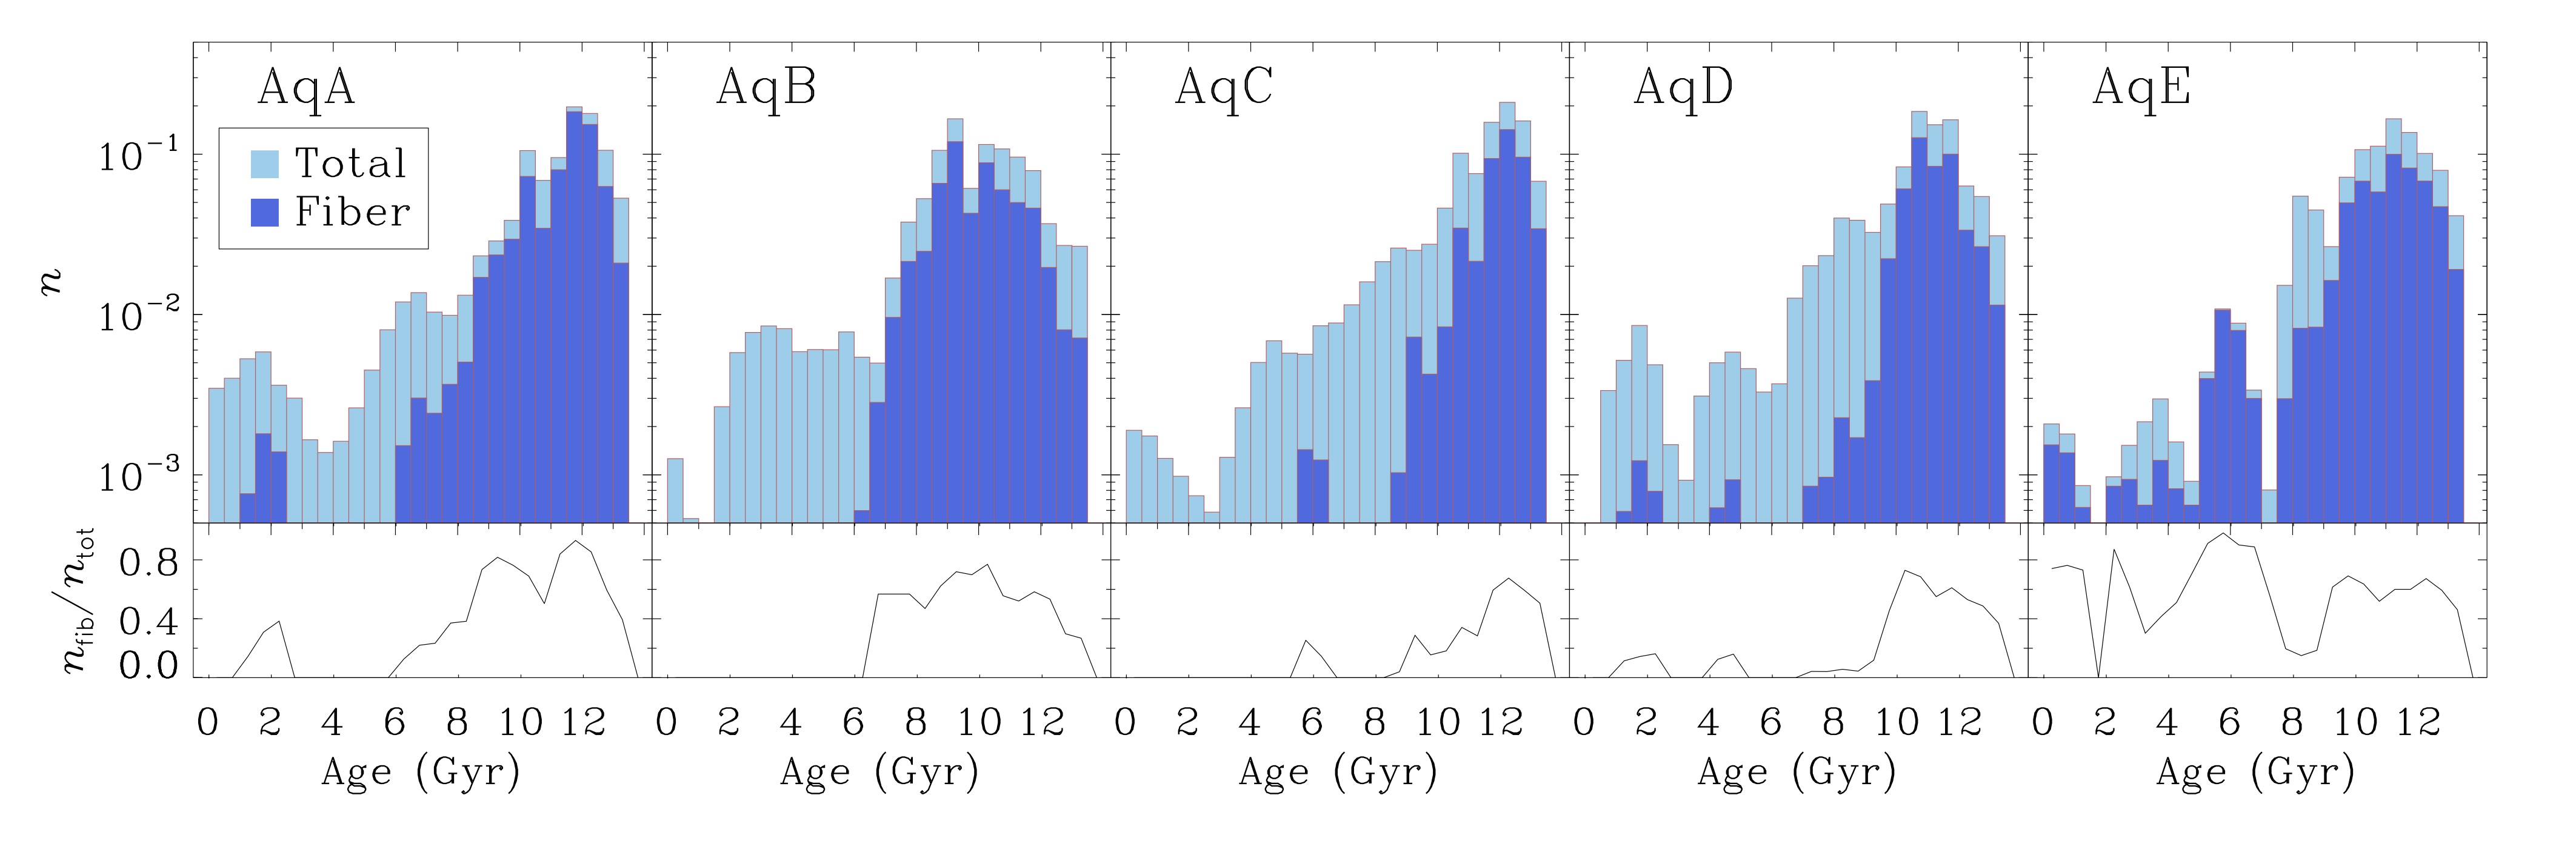
Fig. 3 – For 5 of the galaxies, the ages of all particles in the galaxy are shown in light blue. The dark blue shows which particles would be observed if a fiber limited the view to the interior of the galaxy. Since the interiors are made of older stars, most galaxies (with the exception of AqE) would be observed to be older than they truly are.
One of the most significant effects was that of fiber-size bias. Most observational surveys use fiber-fed spectrographs, which direct the light from a narrow region of the sky down an optical fiber to the spectrograph. Therefore, the observed spectrum may only represent the inner portion of the galaxy where the fiber collects light. The authors found that properties such as age and metallicity were especially biased by this effect. This is because many galaxies have older, more metal-rich stars in the inner regions. So, using spectra gathered from the interior of a galaxy will not capture the younger, more metal-poor stars. Fig. 3 shows this effect for 5 of the galaxies.
Another significant effect was “light-weighting” the properties, particularly age. More massive, brighter stars die out very quickly. So, between two star particles which are identical save for ages, the younger particle will produce much more light. The authors found this will bias the observational techniques towards measuring younger ages. The observed “light-weighted” ages of galaxies are likely younger than the true average age, averaged over the mass of each particle.
So All Our Observations Are Wrong?
Luckily, it’s not so simple. While the authors point out important biases involved in measuring a few properties of galaxies, most of the observational techniques used are fairly robust. Techniques which measure total stellar masses, for example, are shown to be robust to within 10-20%, and are neither biased high nor low. Primarily, the results highlight the degree of random error (not systematic) inherent in deriving observed properties. Error bars should likely be larger than they are thought to be.
Furthermore, there are still uncertainties in the SPS models used to post-process the simulations. They were, after all, a major step between the “true” values derived from the simulation and the “observed” spectra that were analyzed. Until better ways can be found to check these models, it will remain uncertain whether the differences between simulations and observations in the paper were from errors in the observational techniques alone. It is exciting, however, to see that as observations continue to improve, so does the ability of simulations to keep up and help us interpret what we see coming from the universe.