Title: The Galaxy Luminosity Function in Groups and Clusters: The Faint-End Upturn and the Connection to the Field Luminosity Function
Authors: T.-W. Lan, B. Ménard, H. Mo
First Author’s Institution: Department of Physics & Astronomy, John Hopkins University, Baltimore, MD
Status: Under review
Astronomers do a lot of counting. We’ve numbered the satellite galaxies surrounding the Milky Way, polled the planets that orbit each star, enumerated black holes by mass, and so on. It turns out that a simple tally can tell you a lot about the intricate physics of the universe. When it comes to galaxy formation, one such number count comes in quite handy—the number of galaxies of a given luminosity (or brightness). This number count has a well-known form. It’s a power law—typical in astronomy—that decreases with increasing luminosity, then drops exponentially. Brighter galaxies become increasingly far and few in between, and exponentially so for the brightest galaxies. This surprisingly simple relation is predicted by the gravitational growth of structure in the universe, and encodes the subsequent complex, nonlinear physics that governs galaxy formation and evolution. Say hello to the Schechter function.
We’ve realized that the Schechter function, also known as the galaxy luminosity function, differs based on the type of galaxy and its environment. Lonely spiral galaxies, say, follow a different Schechter function than giant elliptical galaxies found in the centers of galaxy clusters. Thus it’s useful to create different luminosity functions for different groups of galaxies—those of a certain mass, color, or shape. The differences in the Schechter function can yield insights into the formation and evolution of different types of galaxies.
That’s what the authors of today’s paper did. They looked at a sample of a large sample of galaxies from the Sloan Digital Sky Survey that appear to live in groups and clusters of galaxies, and split them by the mass of the dark matter halo in which they resided. Their sample ranged from galaxy groups with dark matter halos weighing in at 1012 M☉ to high-mass galaxy clusters of 1015 M☉. For each of nine different galaxy group/cluster mass bins, they numbered the galaxies by luminosity (see Figure 1). One thing immediately became clear: galaxy groups and clusters of all masses have a significant number of faint galaxies. More than predicted by the venerated Schechter formula, which would have a shape like that shown in purple. This unexpected rise in the number of faint galaxies occurs for galaxies with a luminosity less than about 109 solar luminosities. Instead of a single Schechter function, the galaxy luminosity function seem to be well fit by a sum of two Schechter functions, one that fit the bright galaxies, and another that fit the faint ones (the green line in Figure 1).
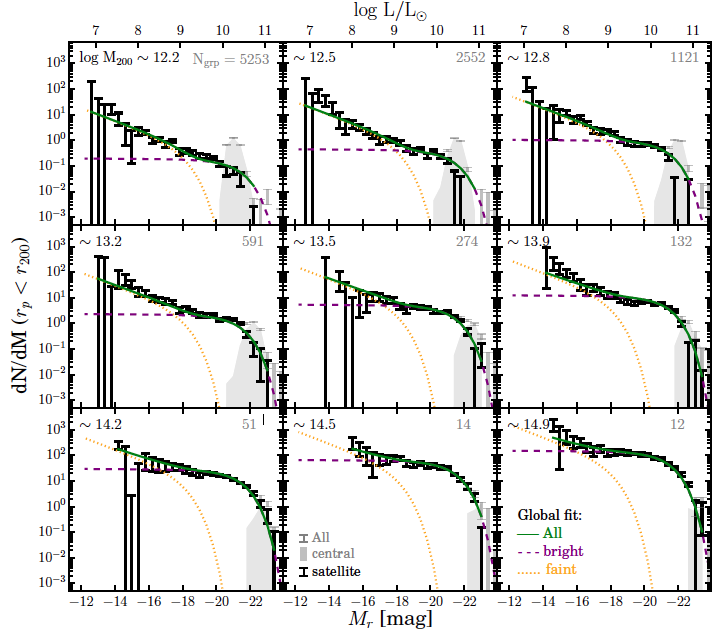
Figure 1. The luminosity function of galaxy groups (top left) to galaxy clusters (bottom right). Typically, the galaxy luminosity function follows the Schechter function, which is a power-law with an exponential cut-off at high luminosities. The authors attempted to fit such a function that fit the bright end (purple dashed line). However, this doesn’t fit the faint end very well. They find that adding a second Schechter function that fits the faint end (dotted orange line) fits the overall observed luminosity function well (green solid line). The excess of faint galaxies appears to be made up of red satellite galaxies. Figure 2 from today’s paper.
Why could this be? The authors dug into their sample further by splitting the galaxies into centrals and satellites. They identified the most massive (often also the brightest) galaxy in each group as centrals, and combined the satellites from all their galaxy groups and clusters to generate a single satellite galaxy luminosity function. Contrary to previous work on central galaxies, the authors found that the satellites exhibited the strange uptick at the faint end. In addition, centrals outnumbered the satellites among the brightest galaxies, whereas most of the galaxies fainter than 109 solar masses were satellites (see Figure 2). The same exercise repeated for red vs. blue galaxies revealed yet another intriguing observation. The luminosity function for blue galaxies across all galaxy group and cluster masses were well described by a single Schechter function, while the red galaxies exhibited the intriguing uptick at the faint end and were better fit by a double Schechter function.
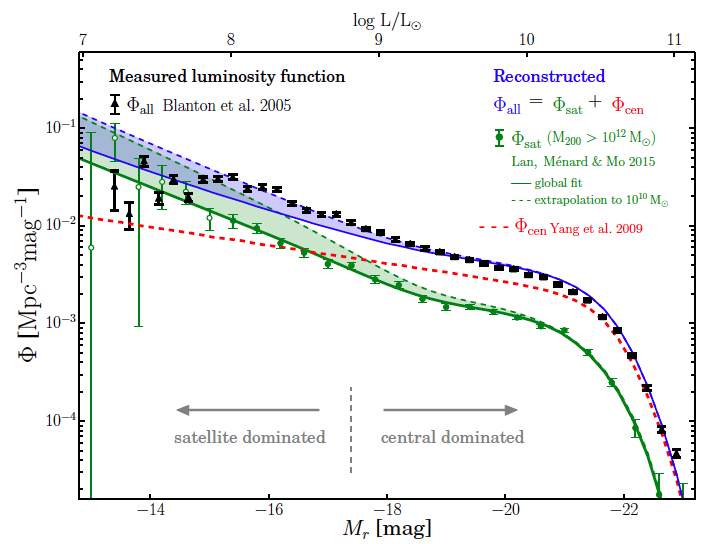
Figure 2. The luminosity function of central vs. satellite galaxies in galaxy groups and clusters. Central galaxies are the brightest and most massive galaxies in their group/cluster. Their luminosity function is shown in red. The remaining galaxies are identified as satellites, and are shown in green. You can see that the brightest galaxies are mostly centrals (the red line lies above the green), but at a luminosity of about 10^9 solar luminosities, the satellites make up a comparable amount, and dominate the faint galaxies. The total luminosity function (the sum of both satellites and centrals) is in blue.
Why are there so many faint satellites? And why are so many of these faint satellites red? It’s unclear. The authors say their results point to a difference in the formation of red vs. blue galaxies. The low-mass galaxies populating the faint end of the luminosity function may have stopped forming stars as efficiently as their high-mass cousins, which caused them to turn red and dead. This and a wealth of other explanations remain to be explored!
Cover image: An image of the Virgo Cluster, a large, nearby cluster of galaxies that contains over 1000 galaxies. This image is was featured on Astronomy Picture of the Day, April 22, 2011.