Title: Cosmology at a Crossroads: Tension with the Hubble Constant
Authors: Wendy L. Freedman
First author’s institution: University of Chicago
Status: Published commentary in Nature Astronomy (2017) [open access]
Last week, I tried to meet a friend for coffee on West 81st Street in NYC. She arrived from the B train to the east, I from the 1 train to the west; after several minutes of confused texting, we realized we had converged upon two different Starbucks.

Figure 1. A real-life text exchange.
Lately, cosmologists find themselves in a similar pickle. Two camps of scientists approach the same problem from opposite sides of the Universe: one, sensibly, by starting now and looking back in time, and the other, preposterously, by starting at the Big Bang. But they are not arriving at the same answer.
Everyone agrees that the Universe is expanding: after all, before the Big Bang, the whole thing occupied no space at all, and just look at it now. The question is, how fast is it expanding?
The speed of space
Usually, we define speed as the distance an object can cover in a set amount of time. A souped-up Subaru station wagon, for example, can travel a cool sixty miles (100 kilometers) in one hour. We can express the speed of any given galaxy (relative to Earth) the same way, although those tend to be faster: kilometers per second.
Astronomers measure the speed of a distant galaxy by measuring the Doppler shift in its spectral lines. Georges Lemaître (father of the Big Bang theory, and thus unfortunately father of The Big Bang Theory) and later Edwin Hubble noticed that galaxies are almost universally moving away from Earth, and furthermore that faraway galaxies are moving away much faster than galaxies nearby.
That makes sense if the galaxies’ movement is being caused by the expansion of space itself: there’s a lot more space in between us and a distant galaxy than there is between us and a next-door neighbor, so a lot more intervening expansion is happening, and the resulting speed is much greater.
You can summarize the effect of the expansion in terms of that relationship between speed and distance: How fast is a typical galaxy moving away from us (km/s) given how far away it is (again km, or more sensibly, megaparsecs)? The answer is known (unfairly to Georges, who measured it first) as the Hubble Constant, H0 (“H-naught”). Astronomers who measure the speed and distance (via standard candles) of galaxies mark H0 at 73.24 ± 1.74 kilometers per second per megaparsec.
Then and now
You can also measure H0 from the Universe as a baby, or at least from a baby photo–the whole sky glows with microwave light left over from when the Universe was only a few hundred thousand years old. It’s important to emphasize that this measurement of H0 will be totally independent from the galaxy-derived one–it comes from light that existed long before galaxies were even close to being a thing. This path to H0 is less straightforward, so bear with me.
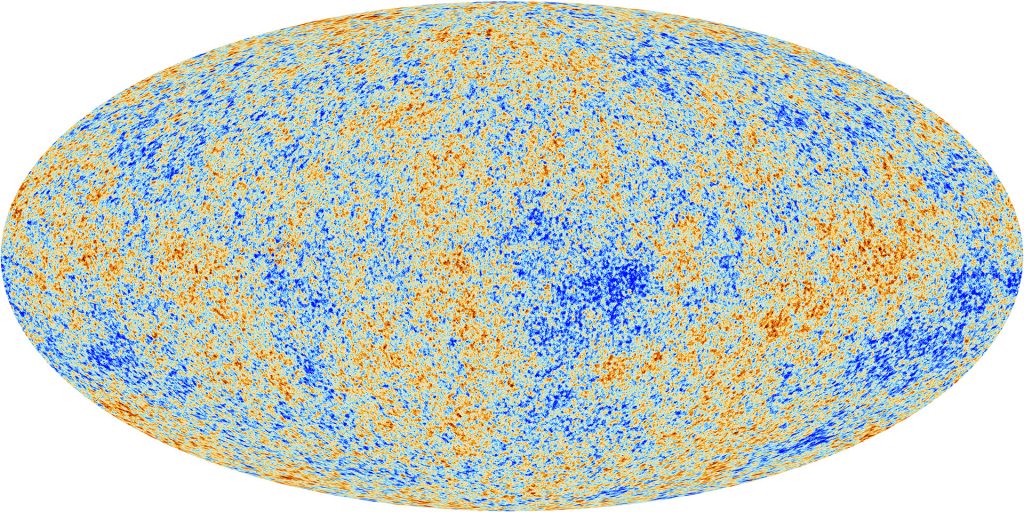
Figure 2. The cosmic microwave background: an all-sky portrait of the baby Universe as observed by the Planck satellite. Blue spots are a tiny bit colder than average, and red spots a tiny bit hotter.
Figure 2 shows the temperature of that ancient light at every point on the sky. There are tiny variations in temperature across the sky, and the precise size and pattern of hot and cold spots is important. Blurring your eyes a bit as you look at Figure 2, you can see that there are big fluctuations from hot to cold–large interspersed patches of mostly red and mostly blue, each covering a sizable chunk of sky. But there are details, too–tiny hot and cold spots of only a couple degrees across, laid over the bigger pattern.
You could approximate Figure 2 by adding together a map of only small fluctuations and a map of only big, then tuning the importance of each till it looked right. If you wanted to improve the approximation, you could try finer size spacings than just “small” and “big”–fractions of a degree, degrees, tens of degrees, etc. Or you could try the opposite–take Figure 2 and break it down into ingredient maps of fluctuations at these various scales. The result is Figure 3 (the so-called “power spectrum” of the cosmic microwave background), which is a recipe for combining the maps in order to make the whole.
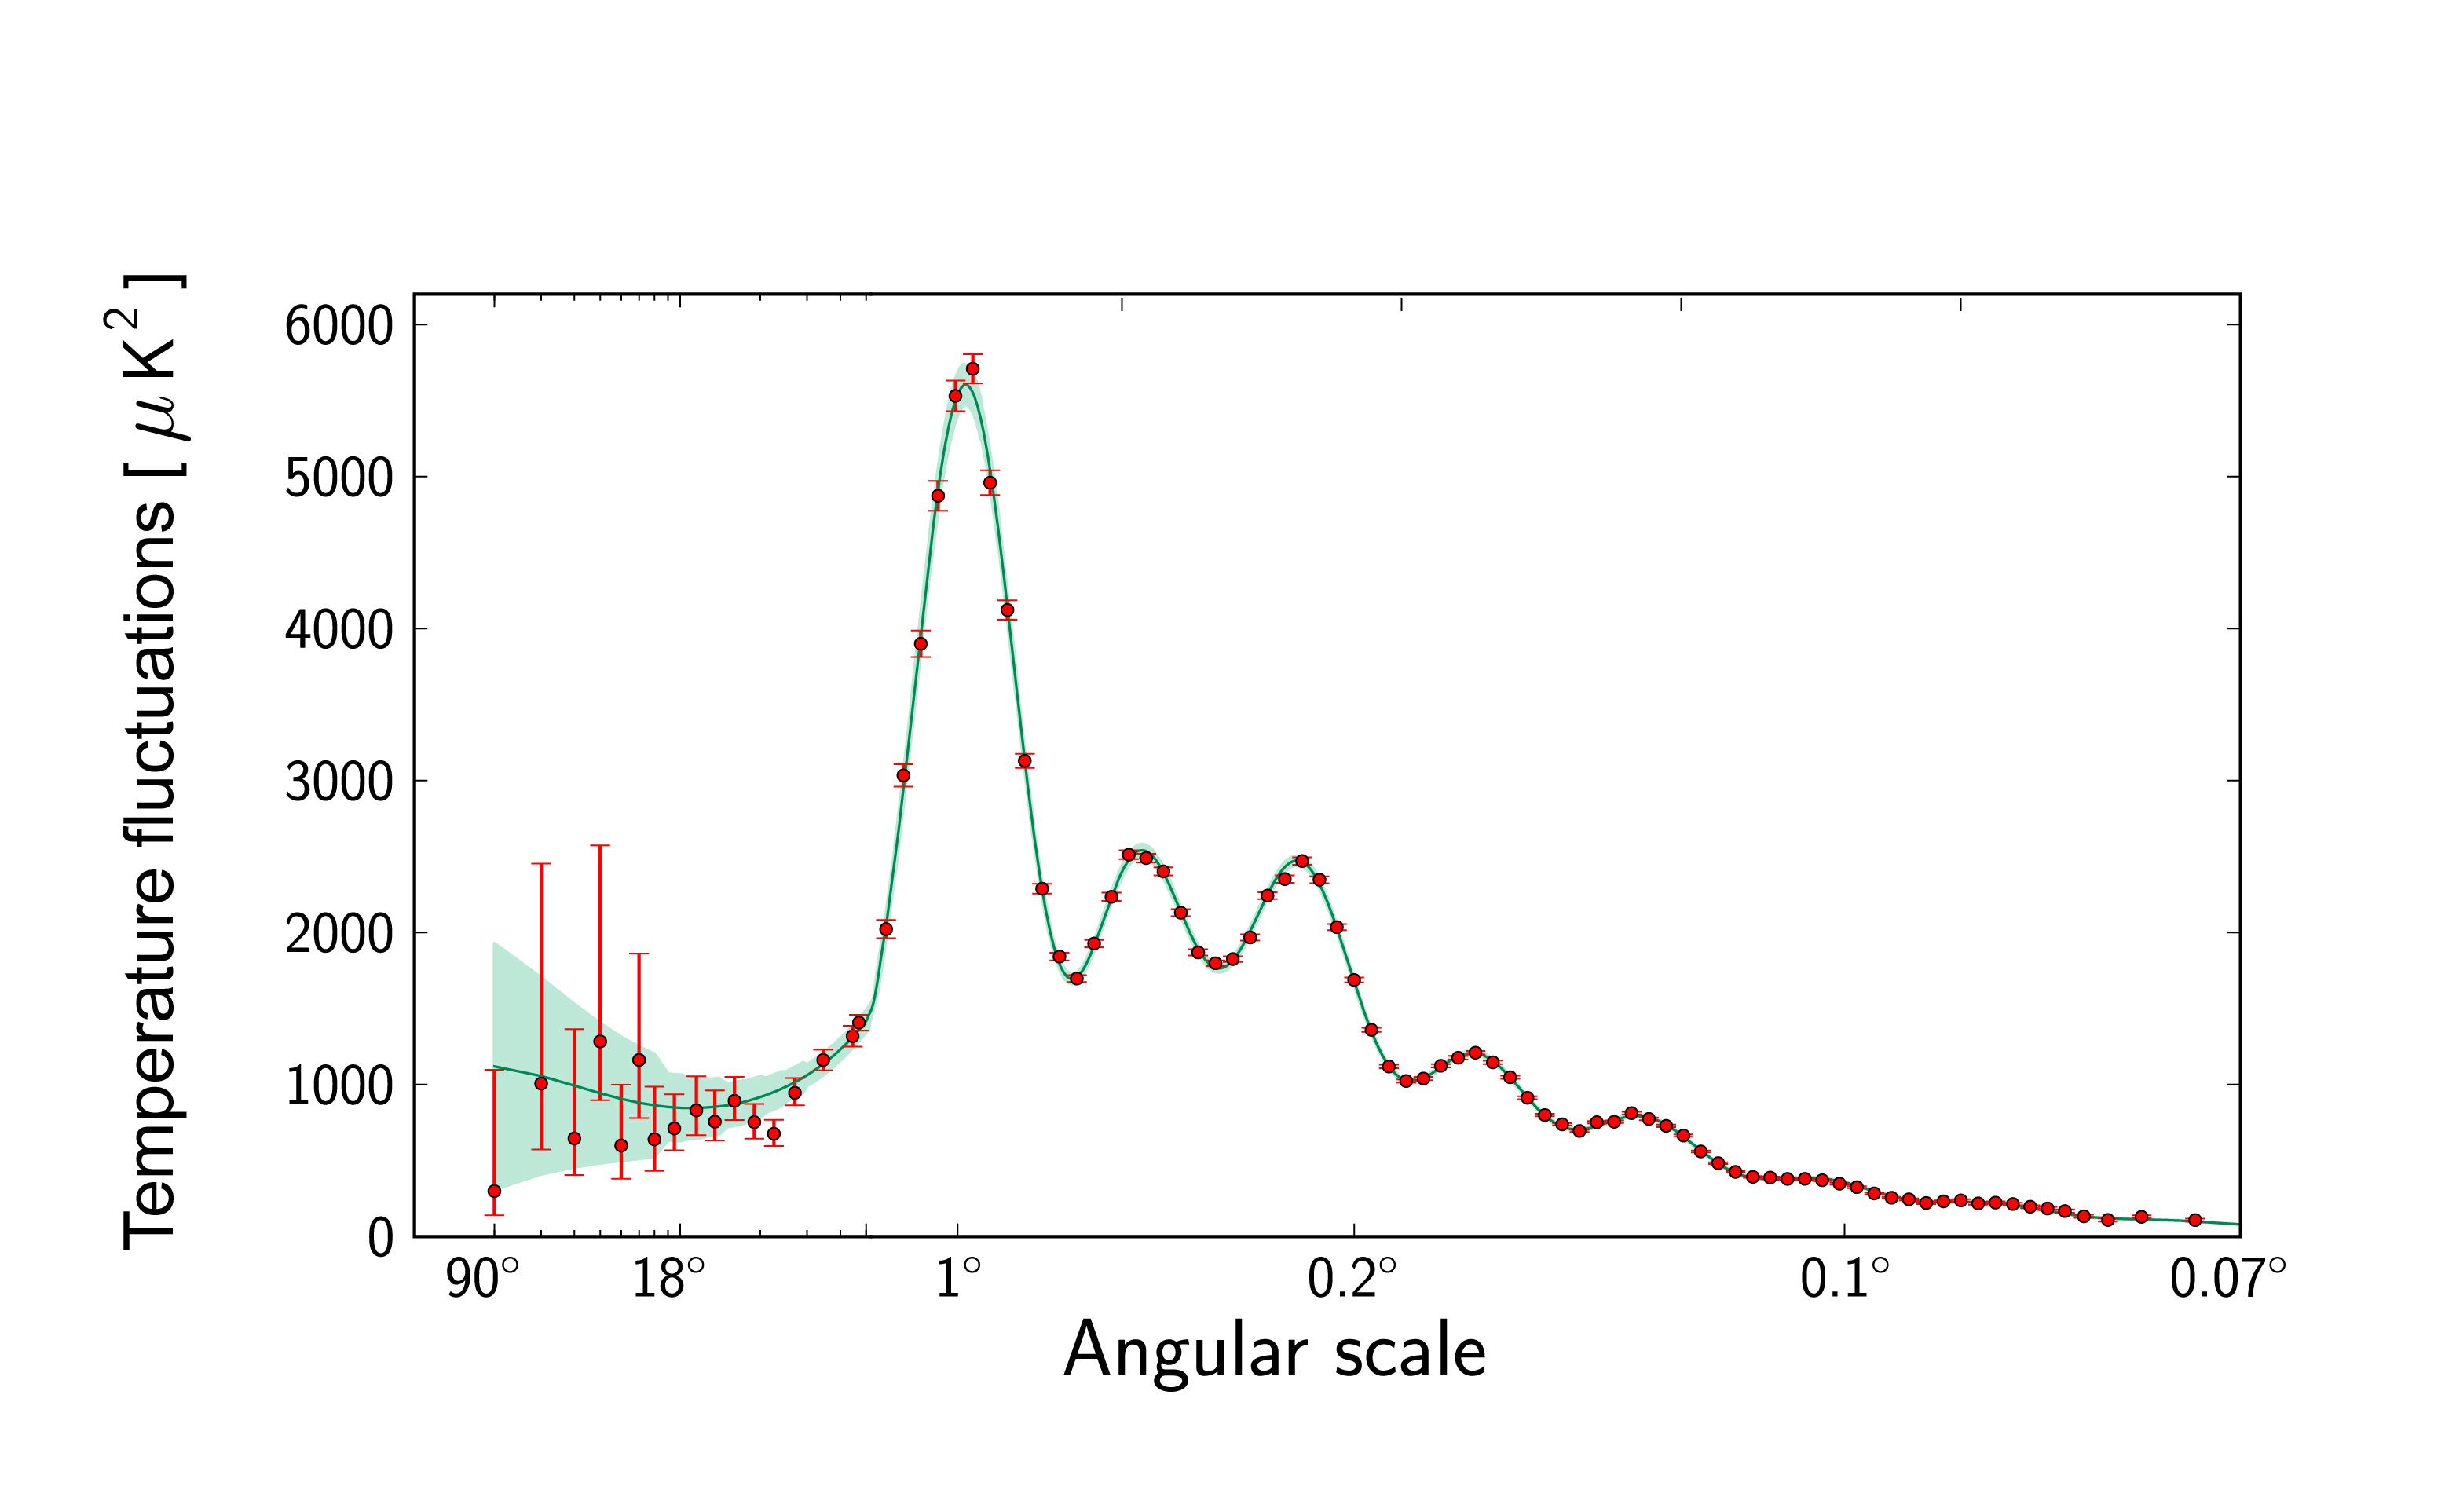
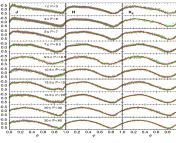
Figure 3. The power spectrum of the cosmic microwave background. Each red data point is one ingredient map you’d need to add in order to re-create figure 2. The x-values correspond to the size of hot and cold spots in each map, and the y-values to how important they are in the overall picture. The green line is the best fit to the data; from the model parameters that control the fit, you can derive H0.
Cosmologists can take this recipe and try to understand why it demands the ingredients it does, in the proportions it does. The green line in Figure 3 is an attempt to model the Planck observations–in other words, to choose a mathematical description of the Universe which matches Planck’s recipe. The description is complex, but it has only a handful of (specifically, six!) tunable parameters, including, for example, how much of the universe is made of ordinary vs. dark matter. From these six parameters, you can derive the Hubble constant: H0 = 67.8 ± 0.9 km/s /Mpc. (Phew!)
Not phew?
All that work, and now the two answers don’t even agree. And they don’t agree by a lot–more than three times their stated uncertainty.
This discrepancy, oddly enough, is a relatively recent development. Until about 2010, it looked like the CMB and galaxy estimates of H0 were both going to converge to the same answer. But as both types of experiment became more precise, their uncertainty bands overlapped less and less. Today’s paper is a commentary–Wendy Freedman, a cosmologist who has made major contributions to the galaxy-side measurement of H0, raising her eyebrow at this situation.
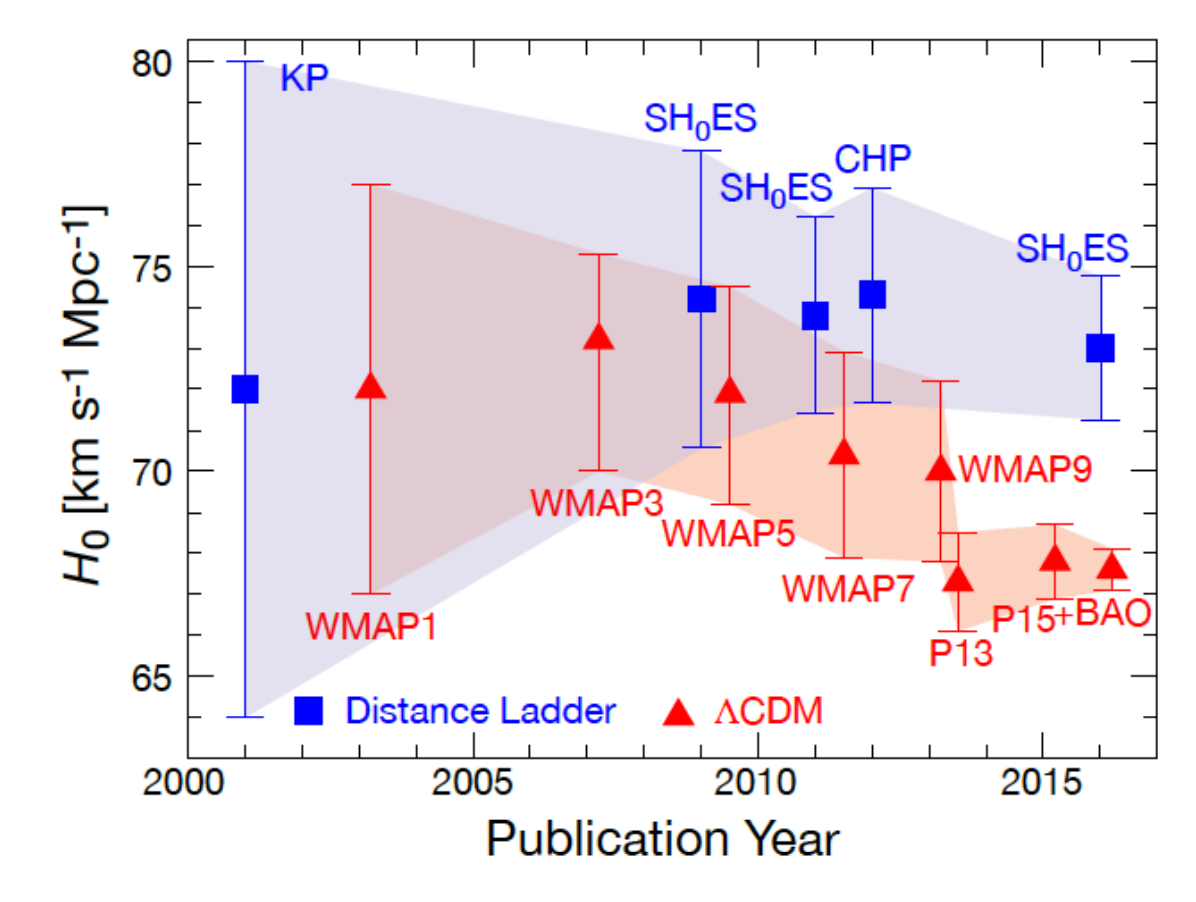
Figure 4. The results of several major H0 experiments conducted over the last 17 years. The measurements in red come from models fit to temperature fluctuations in the cosmic microwave background, which originated in the very early Universe. The measurements in blue come from observations of galaxies, which were born much later. Everything was peachy in the early 2000s, but now we’ve got a genuine statistical disagreement.
How can we reconcile these two measurements, Freedman asks? First, it could be that one or both experiments have unwittingly underestimated their uncertainties. One or both experiments might be biased–for example, maybe we’re systematically underestimating distances to galaxies, or else the foreground signal subtraction in the Planck map (necessary to remove signals from the Milky Way which might otherwise overwhelm the tiny temperature variations in the CMB) is introducing some unforeseen offset to the measured fluctuations.
A second, far more tantalizing, possibility, she notes, is that we don’t understand the physics of the early Universe as well as we think we do. True, six parameters do a very good job at modeling the power spectrum, but there are some persistent, uncomfortable tensions between theory and observation. Perhaps dark matter and dark energy don’t behave as we expect; perhaps gravity acts strangely; perhaps the universe is not as flat as we currently think.
Stubborn disagreements like this–a tiny precession in the orbit of Mercury, un-explainable by Newtonian gravity; a persistent hum in a radio telescope; the outer reaches of galaxies, spinning too fast–have pointed the way to astronomical revolutions before. It might be worth keeping an eye on this one.
Featured image via.
So cool! The best explanation of a Power Spectrum I have ever read. Thanks Emily!
Is there any possibility of the difference of values being due to the fact that the measurements are relative one to the beginning of the universe (CMB) and the other one of the most recent universe? Would it not then have something to do with the acceleration of expansion? It seems coherent to me a smaller value before and a higher value later. In my calculations using other criteria, the value is close to the average of the two: 70.86 km / s / MPC.