Editor: Ian Czekala
This guide, a continual work in progress like our other guides, aims to provide the context necessary to understand much of the spectral jargon in scientific papers on the arXiv. This page will give an overview of how spectroscopy works and what spectral lines are frequently observed by astronomers. In the future, look for more information on how spectral information is taken across the electromagnetic spectrum as well as more information about spectral lines important for diagnostics of certain astrophysical phenomenon.
It is not an exaggeration to state that a large part of astronomical knowledge would have gone undiscovered if it were not for the optical spectrograph. Now, modern spectroscopy techniques work across the electromagnetic spectrum and many important discoveries are being made in regimes previously closed to astronomers, such as the radio, submillimeter, infrared, and x-ray.
Spectrographs
Spectroscopic observational techniques transform the light from an astronomical source into its components, so that we may observe the intensity of the source as a function of wavelength (or frequency, or energy, or temperature, depending on which regime of the E&M spectrum one is in and what the convention is). In practice, this is accomplished via different methods depending on which regime one is observing, however, the principle is the same. To begin, we will describe the optical spectroscope, since it is the most familiar. In the future, look for more information on different kinds of spectroscopes.
If you’ve ever played with a prism before, you have seen how a piece of glass can split light into its various wavelengths, because the index of refraction of the glass of the prism has a wavelength dependence. Thus, red light (the longest wavelength) is bent the least while blue/indigo light (shortest wavelength) is bent the most. If you project this onto a screen (like Newton did), you will see a spectrum. Alternatively, if you’ve ever studied Young’s Double Slit experiment, you might know that light can be split into its components by interference. Diffraction gratings are collections of many slits that act to disperse the light much more cleanly than just two slits, and therefore are used frequently in astronomical spectrographs. Note that with diffraction gratings, red light is dispersed more than blue light, the opposite of prisms. Many modern dual capability imaging spectrographs use grisms, which combine a transmission grating and prism so that a central wavelength of light passes through the grism in a straight line. This allows for high throughput as well as makes it easy to remove the grism and perform imaging of the science target in addition to spectroscopy.
Spectral Lines
Atoms and molecules can emit and absorb radiation at distinct wavelengths, causing the appearance of spectral lines. When acquiring a spectrum of an astronomical object, astronomers rely upon spectral lines to determine a myriad of physical properties, such as composition, temperature, ionization state, velocity, redshift and more. In this section, we will cover the basics of how these characteristics can be determined from spectral lines, with more subsections to be added with time.
For a more thorough introduction to the quantum mechanical treatment of how and why spectral lines are formed, look for an upcoming guide edited by Tanmoy Laskar, or see Griffiths Quantum Mechanics referenced at the end of this post. This section will mostly be phenomenological.
Atomic transitions of hydrogen
The energy levels of the hydrogen atom are described by just one number, the principle quantum number 


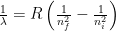
where

As you may remember from intro physics, if a transition occurs from 


Historically, astronomy started as an optical science (for obvious reasons) and even today, optical observations are vitally important to astronomers. Therefore, the Balmer series is very frequently invoked in observations, because it primarily covers the optical wavelengths. Astronomers have taken to labeling the Balmer series of transitions with Greek letters. For example, the 


Likewise, the Lyman and Paschen series are named by Greek letters as well. 


Tabulated wavelengths for first few transitions
| Line | Wavelength (Angstroms ( )) )) |
| Lyman Series | |
 |
1216 |
 |
1026 |
 |
973 |
 |
950 |
 |
912 |
| Balmer Series | |
 |
6563 |
 |
4861 |
 |
4340 |
 |
4102 |
 |
3646 |
| Paschen Series | |
 |
18700 |
 |
12800 |
 |
10938 |
 |
10049 |
 |
8200 |
Please note that the agreement of these wavelengths listed in the table might not be exactly what one would obtain via the Rydberg formula, but they are close, and for quick calculations it is good enough to use the Rydberg formula. These differences arise from quantum mechanical effects such as fine structure, the Lamb shift, and hyperfine structure. For more information, please see the texts by Griffiths or Bransden and Joachain in the references below.
Here we have talked about emission and absorption lines from hydrogen, the simplest atom in the universe. Of course, there are characteristic lines from many-electron atoms, such as oxygen, nitrogen, neon, iron, and practically every other element. Additionally, molecules also emit characteristic molecular lines that can be used to trace dense clouds, for example 

Line profiles
A great deal of information can be extracted by detailed examination of spectral lines, such as redshift, radial velocity, expansion velocity, temperature, and much more. This section will grow as more authors cover particular spectral methods that appear in the literature.
- P Cygni profiles
- HI 21cm lines explained via Ian’s post for our Interstellar Medium Course at Harvard, taught by Professor Alyssa Goodman.
References for More Information:
General Astronomy Methods
- Astronomy Methods, by Hale Bradt
- Astrophysical Techniques, by C.R. Kitchin
- Handbook of CCD Astronomy, by Steve Howell
Interpreting Spectroscopic Data
- Interpreting Astronomical Spectra, D. Emerson
- Stellar Spectral Classification, Richard O. Gray and Christopher J. Corbally
- Spectroscopy of Astrophysical Plasmas, A. Dalgarno and D. Layzer
Interstellar Medium Spectroscopy and Processes
- Physics of the Interstellar and Intergalactic Medium, Bruce T. Draine
How Spectrographs Work
- Astronomical Spectrographs and their History, by John Hearnshaw
- Astronomical Optics, by Daniel J. Schroeder
- Astrophysical Techniques, by C.R. Kitchin, Chapter 4
Spectroscopic Observation and Reduction Techniques
- Astronomical Spectroscopy, by Phil Massey
- IRAF Spectroscopy Documentation
Quantum Mechanics
- Introduction to Quantum Mechanics, by David J. Griffiths, 2nd edition
- Physics of Atoms and Molecules, by B.H. Bransden and C.J. Joachain, 2nd edition
/tdem