- Title: DASCH on KU Cyg: a ~5 year dust accretion event in ~1900
- Authors: Sumin Tang, Jonathan Grindlay, Edward Los, Mathieu Servillat
- Institution: Harvard/CfA, Cambridge MA
The Corot and Kepler space telescopes are photometrically monitoring stars over multiple years (Corot was launched in 2006 while Kepler has been watching the sky for a year). Both of these projects have studied the variability of stars and have produced some very interesting results, some of which we’ve talked about here on astrobites (Corot, Kepler). Other observing programs, such as the 5-year Palomar Transient Factory scan the sky for new transient objects, including supernovae and variable stars, which can then be followed up. Some stars out there have been monitored for decades.

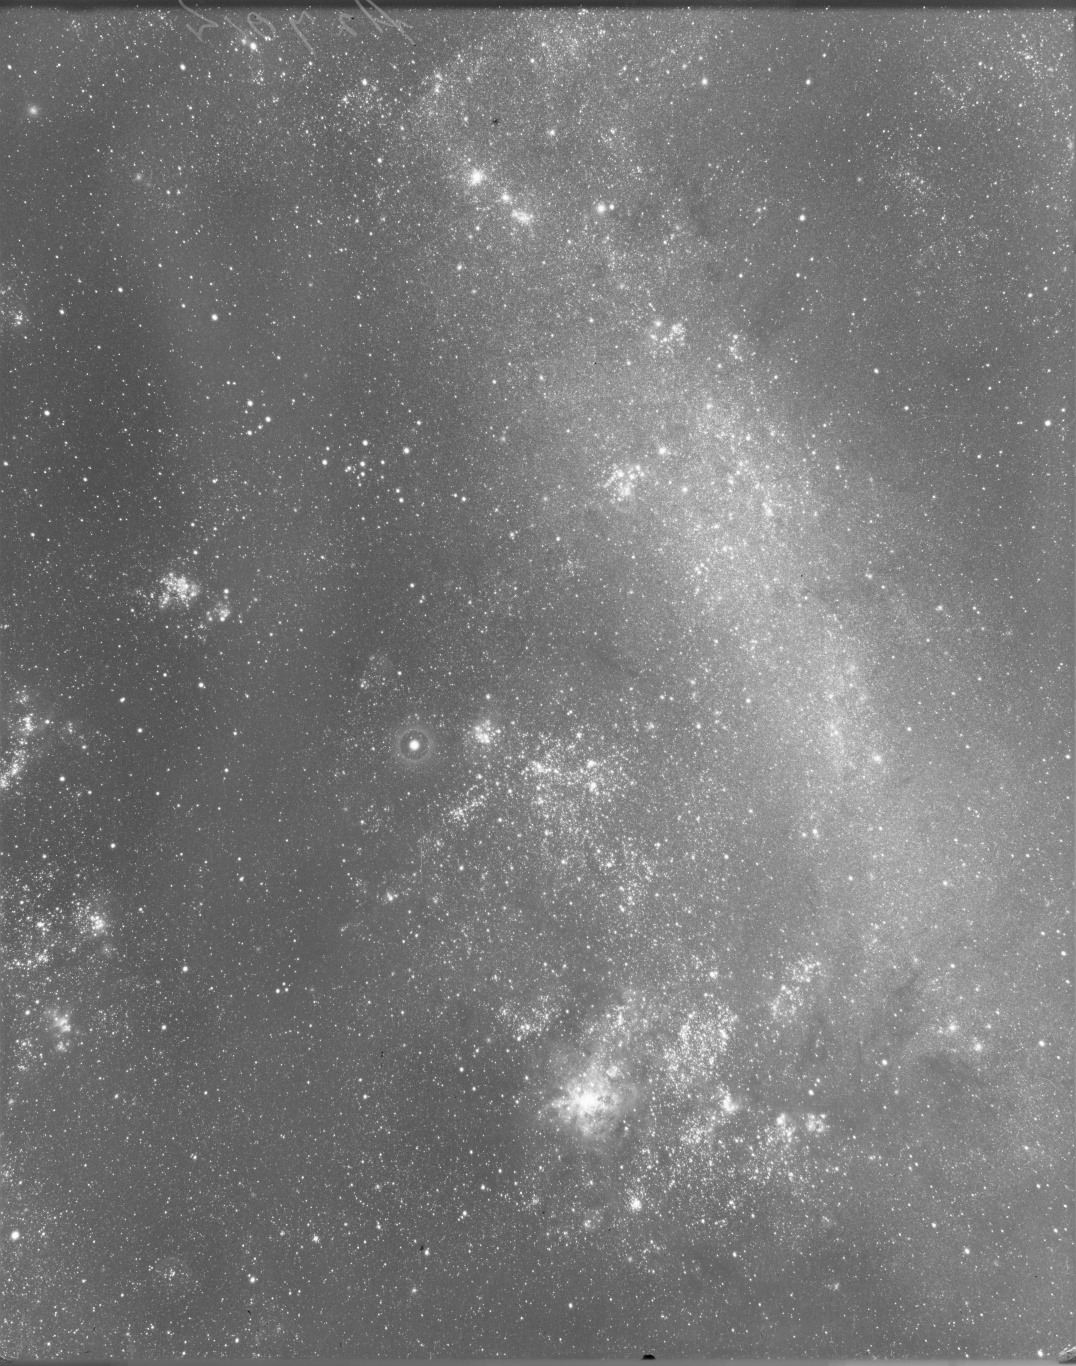
A photographic plate from the DASCH gallery. This is a 60 minute exposure of the Large Magellanic Cloud from 1949.
But how do stars behave over even longer timescales? While we can’t wait around for a hundred years to study how stars vary on very long timescales, we can go back and look at images taken over the last century. However, these data were taken before the advent of the CCD and are instead stored on photographic plates. The DASCH (Digital Access to a Sky Century @ Harvard) Team has been scanning and digitizing these plates since 2005 and can look at the photometric variability of stars over the last century. There are half a million plates in the Harvard archive and and you aren’t even done once you’ve scanned a plate. The DASCH website describes the process of mapping the plate onto the sky, removing defects and calibrating magnitudes.
This paper presents the most recent DASCH discovery, which concerns the star KU Cyg. This is an eclipsing binary system in which a more massive F star is gaining mass from a red giant. The F star is also surrounded by a thick and dusty accretion disk. The light curve of this star over the last century – from 1890 to 1990 – is in the figure below. The most notable features are the red circles, which mark eclipses of the F star by its companion. They are accompanied by either a black dot with error bars indicating a DASCH measurement, or a blue arrow, when only an upper limit on the magnitude could be determined.
The other feature apparent is a 0.5 magnitude drop in the brightness of the star around 1900 that lasts 5 years. None of the neighboring stars on the plate show a similar feature and the stars orbit each other on a 38 day period, not a 5 year period, so the authors are convinced that this dip is real and unrelated to the eclipses. The authors argue that this dip results from a sudden increase in mass transfer between the two stars. This adds dust to the accretion disk which migrates inwards over several years, resulting in a decrease in the total amount of light that reaches us. After several years, the excess dust gets too close to the F star and evaporates and the star brightens rapidly.

The light curve of KU Cyg from 1890 to 1990. Black points with error bars are DASCH measurements, binned by year, while blue arrows indicate upper limits. The red circles show the expected primary transits, which agree well with the data. One notable feature of the data is the five year dip in brightness starting in 1899.


Trackbacks/Pingbacks