Paper title: A dynamical measure of the SMBH mass in a quasar 11 billion years ago
Authors: R Abuter, F Allouche, A Amorim, C Bailet, A Berdeu et al.
First Author’s Institution: European Southern Observatory, Garching, Germany
Status: Published in Nature [Open Access]
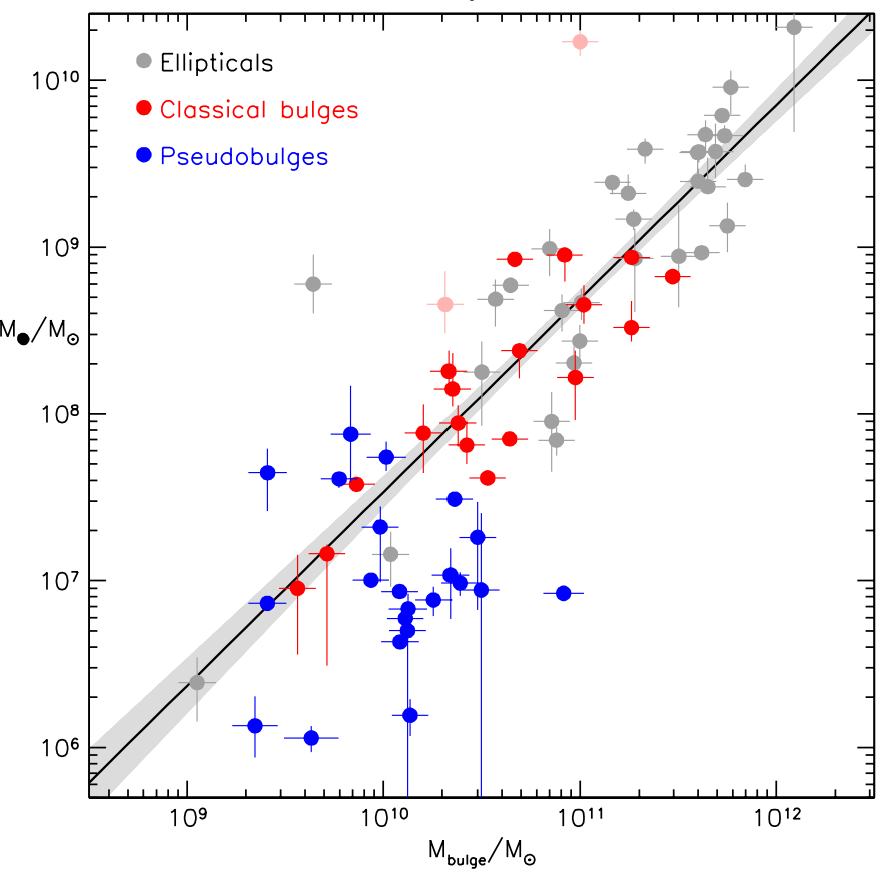
When we take a look at the masses of galaxies and the supermassive black holes (SMBHs) residing at their cores in our nearby universe, we notice a striking connection (see Figure 1). The more massive the galaxy, the more massive is its SMBH. It seems like the SMBHs and their galaxies are closely linked, almost like they’re evolving together. This connection could be caused by feedback that controls the growth of the galaxy and the SMBH. So, if we want to really understand how galaxies form and change over time, it’s crucial to delve into this feedback mechanism and their intertwined evolution at different points in cosmic history.
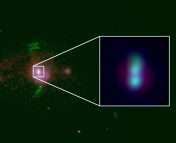
In this article, the researchers looked at one of the brightest quasars from about 11 billion years ago, when stars and SMBHs were forming and growing at their peak. This era is called the “cosmic noon.” Their main goal was to figure out how heavy the SMBH at the center of the quasar was by checking how fast the broad line region (BLR) (see below!) around it was moving. The mass obtained from studying the motion of the objects around the object of interest is called the dynamical mass.
Quasar? Broad Line Region?
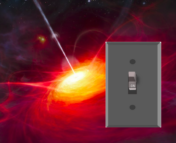
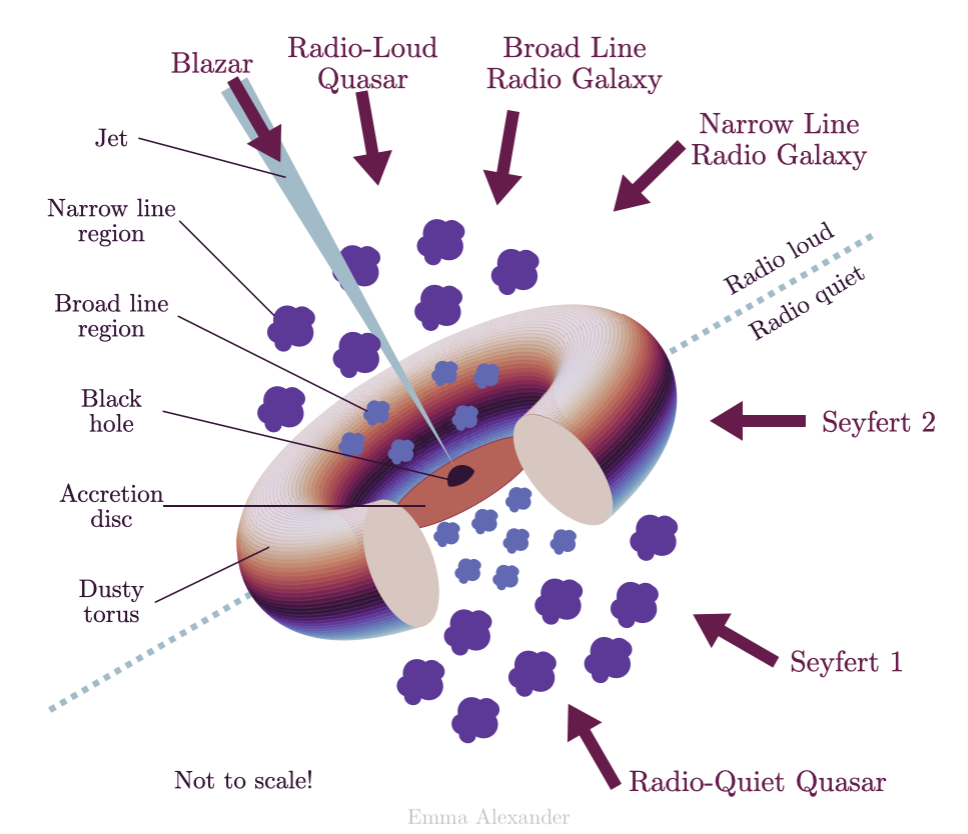
A quasar is a type of active galactic nuclei (AGN) consisting of several components: the central black hole, an accretion disk – gas swirling around the black hole, and jets shooting out from the disk’s poles. Surrounding these components are clouds of gas known as the broad and narrow line regions, distinguished by the width of the spectral lines they emit. Beyond these regions lies a dusty torus. According to the unified model, all AGNs are essentially the same, but they appear different to us depending on our viewing angle, leading to a variety of observed AGNs, as depicted in Figure 2.
Basics of an Interferometer
Imagine you have several telescopes or antennas spread out across a wide area. Instead of using each one independently, you pair them up, similar to slits in a double-slit experiment. When the light from distant sources reaches the paired telescopes, it gains a “phase difference.” This means the light waves are slightly out of sync with each other. When these out-of-sync waves interfere, they create an interference pattern.
Scientists can analyze this interference pattern to construct detailed images of astronomical objects. The working principle of the interferometer is very elegant,
Interference pattern from the telescope = Fourier transform{Image of the sky}
This technique mimics having a telescope as large as the largest distance between the antennas, allowing astronomers to study the universe with remarkable resolution (as resolution is directly proportional to the size of the telescope). This method is the same one astronomers used in radio wavelengths to make the first image of a black hole using telescopes worldwide to “make” a telescope as large as Earth.
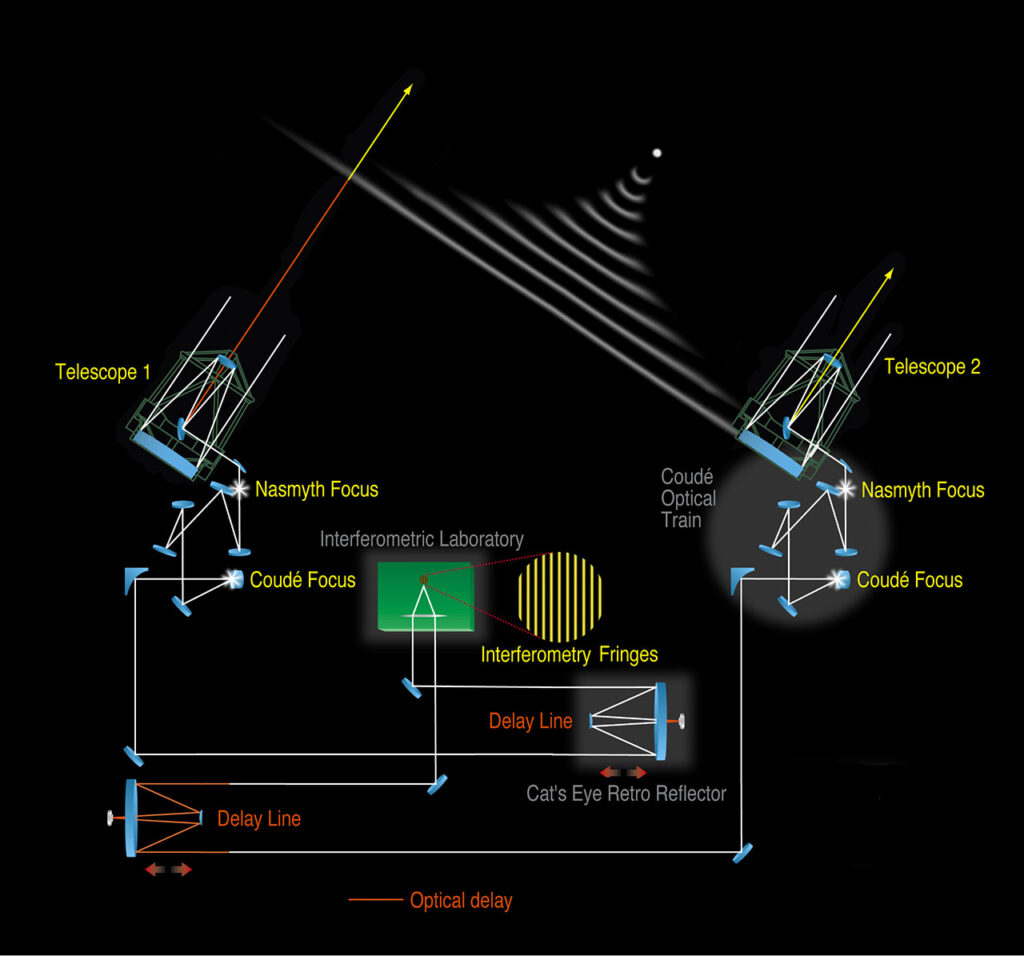
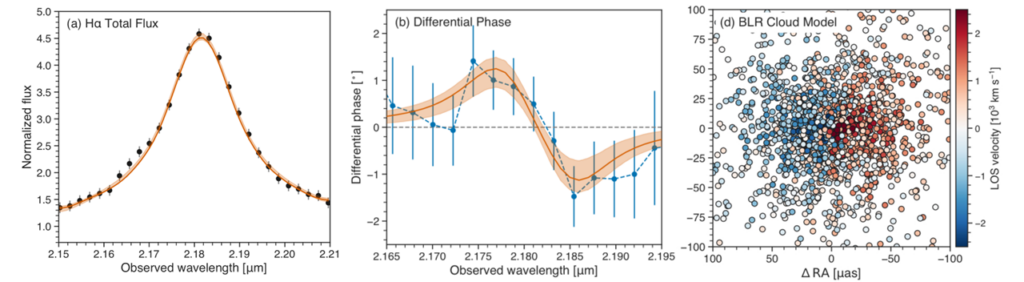
The observation for this study was conducted using the Very Large Telescope Interferometer (VLTI) with GRAVITY+, an instrument providing VLTI with its interferometric abilities. VLTI comprises four telescopes, resulting in six distinct pairs that function as interferometer slits. The observation was carried out at a wavelength of approximately 2.2 micrometers (in the infrared region) to gather data on the Hα emission line, which occurs when an electron transitions from atomic energy level 3 to 2, losing energy as emitted light in the process. Along with the Hα spectrum, the authors also measured the differential phase spectrum, obtained when you subtract the phase from the interferometer patterns of different wavelengths from the phase of a reference wavelength.
Step 1: Measure the Mass of the SMBH
To determine the mass of the SMBH, the researchers treated the BLR as a collection of clouds moving independently within the gravitational field of the SMBH. They adjusted the model to recreate both the observed Hα and differential phase spectrum, allowing them to derive the best-fit estimate of the SMBH’s mass. They measured the dynamical mass of the SMBH to be 3.2 x 10⁸ M☉.
Step 2: Measure the Mass of the Galaxy
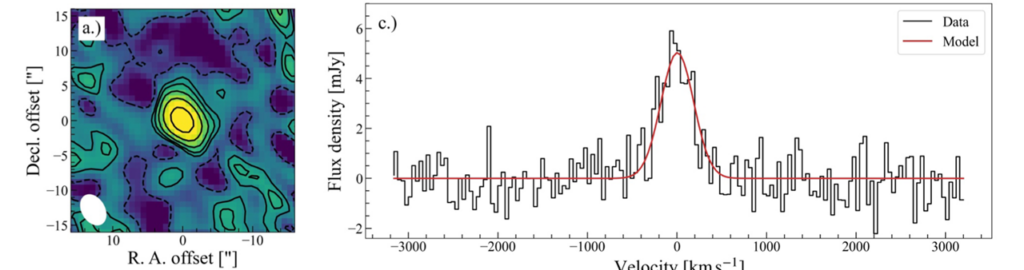
Now, the authors aim to find out how much stars weigh. They looked at the carbon monoxide (CO) emission line with the NEOMA telescope. Using a simple formula, they changed the width of this emission line into the galaxy’s dynamical mass. Then, using another empirical relation based on observations, they converted the dynamical mass into stellar mass. They measured the stellar mass of 2.5 x 10¹¹ M☉.
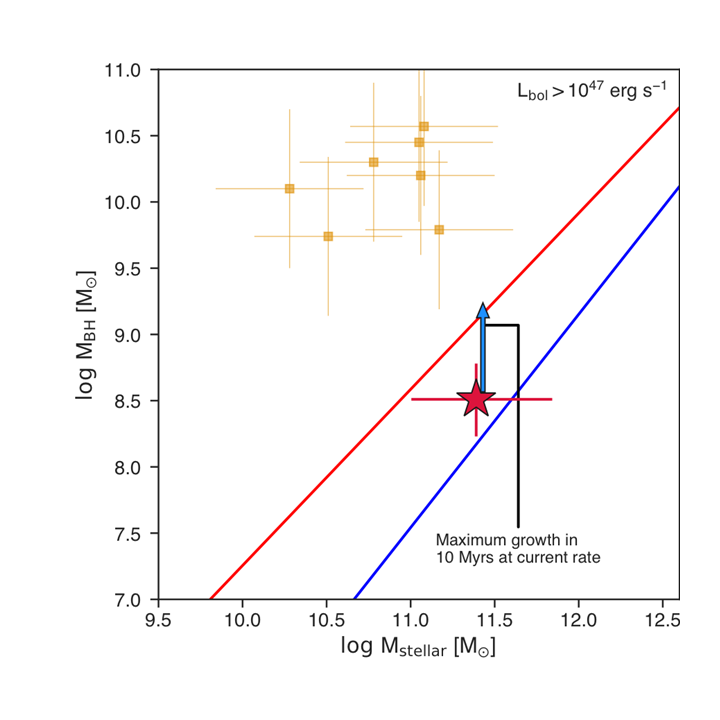
Does it follow the local relation?
Now that the authors have found out how heavy the SMBH and the stars are, they can compare them on a local relation plot like Figure 1 and see if they match up. Guess what? They don’t! The SMBH is less massive for the mass of its host galaxy. This suggests that some galaxies grow faster than their supermassive SMBHs. The SMBH probably didn’t grow efficiently because explosions from dying stars (supernova feedback) blew the gas away when it tried to reach the SMBH at the center, putting the black hole on a diet! The SMBH can grow only when the galaxy becomes big enough to keep the gas in its center.
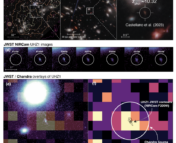
Thanks to the GRAVITY+ instrument and its interferometric methods, we can achieve super sharp images, up to 40 times better than what JWST can do! This awesome new tech lets us explore the space near SMBHs even when they’re far away (at high redshifts), something we couldn’t do before. This opens up exciting new possibilities for scientific discoveries.
Astrobite edited by Cole Meldorf
Featured image credit: ESA/Hubble & NASA, A. Filippenko