- Title: Impact of star formation history on the measurement of star formation rates
- Authors: M. Boquien, V. Buat, and V. Perret
- First Author’s Institution: University of Cambridge
- Paper Status: Accepted for publication in A&A
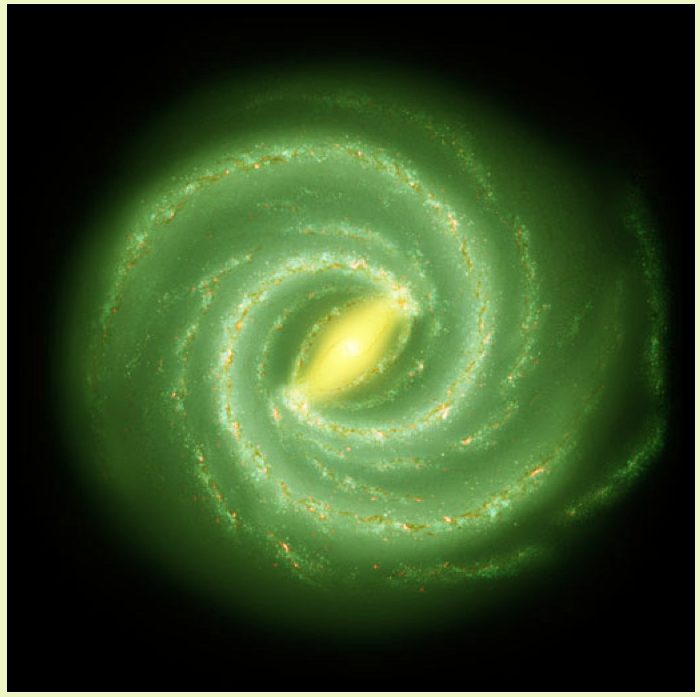
Astronomers constantly try to use what we can observe now to deduce facts about the past. The star formation rate (SFR) and the star formation history (SFH) are two of the key components used to describe and understand the evolution of galaxies. The star formation rate is the total mass of stars formed per year, often given as solar masses per year. The star formation history is how stars formed over time and space, whether in short bursts or over longer periods. Both of these are important quantities that help characterize the history of galaxies. For example, it is thought, though still debated, that the Milky Way had several bursts of star formation in the past and the current star formation rate is around one solar mass per year.
Most measurements of the star formation history assume that star formation occurred in one burst at a constant rate over 100 Myr. This assumption might be true for spiral galaxies evolving by themselves. However, the star formation history for a galaxy that had violent mergers in the past is likely to be much more complicated. This paper seeks to understand whether 100 Myr is a fair assumption. By modeling different galaxies with different star formation histories the authors compare the simulated SFR with what astronomers would measure.
Astronomers use five main methods to measure the SFR. Each measures the flux at different wavelengths to back out the recent star formation. The most massive stars are brightest in the UV. Studying either the far or near UV flux (FUV and NUV) constrains the recent formation of massive stars which provides the majority of the SFR. This method has also been applied by looking at the U band flux. Studying the total IR emission works in a similar fashion. These very hot stars heat dust grains which re-radiate the energy in the IR. Finally, the Lyman continuum emission is responsible for ionizing the hydrogen in star forming regions, which can be traced through specific recombination lines.
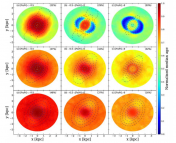
The authors used a simulation called MIRAGE to simulate 23 different galaxies. These galaxies included a combination of merging galaxies and isolated galaxies. The galaxies varied over their initial masses, orientation, and initial gas fraction meant to represent galaxies between redshifts of 1 and 2. These simulations were run for 800 Myr at 1 Myr timesteps. A simulated spectrum for each galaxy was made at each timestep. This allowed the authors to compare the simulated SFR with different commonly used methods for measuring the SFR from spectral information.
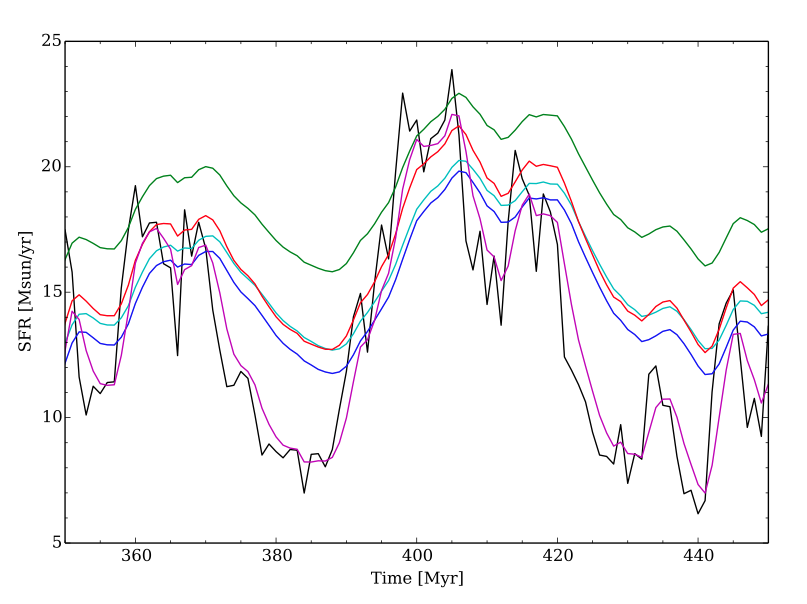
Figure 1: The calculated SFR as a function of age compared to the known SFR from the simulation. Black is the known SFR. Magenta is from the Lyman continuum method. Blue is the Far UV measurement. Cyan is the near UV measurement. Green is the U band measurement. Red is the total IR measurement.
Figure 1 shows the results of the simulation and measured SFRs between 350 Myr and 450 Myr. The results from this time segment are the same as at all other times in the simulation. The true SFR is shown in black while all the other curves are various methods of measuring the SFR from the simulated spectra. The Lyman continuum method (shown as magenta) follows the true SFR quite well. All other methods overestimate the SFR by 25 per cent to 65 per cent.
The authors then seek to understand why the SFR would be significantly overstated in so many of these measurements. Many stars will live longer than 100 Myr. These stars will still contribute flux to the measurements, but will bias them because they do not represent the actual star formation over the past 100 Myr. Correcting for these long-lived stars reduces the overestimate of the SFR in the various methods down to 10 per cent.
With this in mind, the authors advise that the method used to measure the SFR should be carefully chosen based on the type of galaxy being studied. The authors suggest that a longer timescale, of order 1 Gyr rather than 100 Myr, be used for isolated galaxies to account for contamination from older stellar populations. Star-bursting galaxies with rapid, ongoing star formation permit instead shorter timescales as the contribution from these older populations will be fractionally smaller.
These results help put measured star formation rates in real galaxies in perspective. Most methods discussed in this paper overestimate the true SFR. This overestimate can help astronomers calibrate the exact role that the SFR does play as galaxies evolve over time. And how that relates to the SFR shutting down.
This is an interesting update to older models of star formation history. I’m a little bit unclear about why previous models overestimated SFR, is it mainly due to the consideration of too short a time scale?