Title: A continuum from clear to cloudy hot-Jupiter exoplanets without primordial water depletion
Authors: Sing, D., Fortney, J., Nikolov, N., Wakeford, H., et al.
First Authors Affiliation: University of Exeter
Paper status: Published in Nature
Almost every astrophysical process we know of was discovered by observing a large census of seemingly identical objects. The famous Hertzsprung-Russel diagram, which shows the relationship between temperature and luminosity in stars and gives insights into stellar evolution, was only uncovered when Hertzsprung and Russel were able to utilize large scale photographic spectroscopy surveys to look at and compare several hundreds of stars. They didn’t fully characterize each individual star. Instead, they looked at two simple and measurable features: apparent magnitude and the strengths of a couple absorption features as a proxy for temperature. These measurements for a stellar sample of 1 or 2, would not have yielded scientifically interesting results, but when compared to 100 others, patterns started to emerge.
In exoplanet science, we are at, what I’ll call, the “pre-HR diagram” stage. We have only been able to detect a few molecular absorption features in the atmospheres of just a handful of planets. Water absorption, for example, has been detected in the atmospheres of hot Jupiter exoplanets. The strength of these absorption features, though, has varied from planet to planet and has led various authors to make predictions about why this is— Maybe the planets with low water content were formed in part of a disk where water has been depleted? Maybe the water is actually there but clouds are muting the absorption features? With so few observations, it’s been hard to answer these questions. The authors of today’s astrobite observed the atmospheres of ten hot Jupiter planets all orbiting different host stars. Of course, ten planets won’t make the modern day exoplanet HR diagram but it does give us ten data points on what has previously been a blank canvas.
Below, Figure 1 shows the transmission spectra of ten different hot Jupiter atmospheres observed with the Hubble Space Telescope. For more info on how we get these spectra, I’d suggest reading this previous bite. These planets range in temperature from 960 – 2510 K, in mass from 0.21 – 1.50 times the mass of Jupiter, and in period from 0.79- 4.46 days. For perspective, Mercury orbits the Sun in an 88 day period and has an average temperature of 440 K. There is nothing in our Solar System remotely comparable to these ten planets. To showcase similarities and differences between each exoplanet’s atmospheric spectra, the authors have plotted everything on the same figure. The solid colored lines in the figures are the best fit atmospheric models, while the colored dots showcase the actual data. To the untrained eye, these might seem a bit intimidating. But, if you know what you are looking for, you don’t even need complex models to gain insights into these planetary atmosphere:
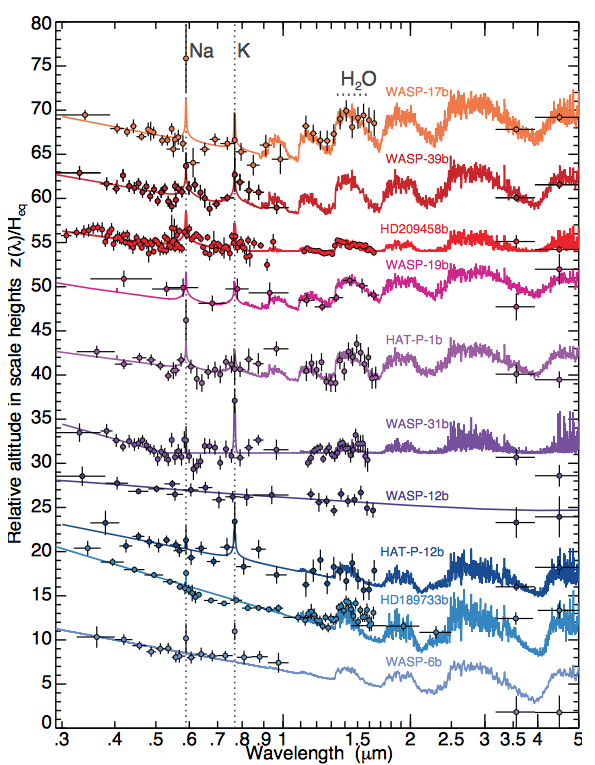
Transmission spectra of hot Jupiter planets observed with the Hubble Space Telescope and Spitzer. Solid colored lines show the atmospheric models while the colored dots show the observed data.
Absorption Features:
Absorption features are probably the most striking feature of a planet spectrum because they jump off, what we call, the “continuum” of the spectrum. Let’s start with WASP-17b in Figure 1. Try for a moment to ignore the solid line and focus on the orange dots. You should notice from the data points alone that there is probably sodium and water absorption in the atmosphere of WASP-17b. The reason I suggested ignoring the solid colored model is because although the model indicates present of potassium, no potassium was actually detected. This can get tricky.
Now, glance at the other spectra and try to figure out which other planets also contain sodium, which contain potassium and which contain water. Bear in mind, that like finger prints, molecules have unique wavelength at which they absorb at. This means that any feature you see at 0.6 microns will be Na, any feature you see at 0.78 microns will be K and any feature you see at 1.5 microns will be water.
Sodium was detected in five planetary atmospheres, potassium was detected in four planetary atmospheres, and water was detected in five. How well did you stack up?
Detecting the features is only half the battle. You might’ve noticed that while water was present in the atmosphere of WASP-17b and HD 209458b, their features look incredibly different. HD 209458b’s looks a bit muted. Why is that? And what about those planets that exhibit no features at all, like WASP-12b? What are their atmospheres made of?
Clouds and Hazes
On Earth, there are few (or no) days that go by when there are blue skies throughout the entire planet. The bottom line is, every planet or moon in our Solar System with an atmosphere has some degree of clouds or hazes. It is, therefore, no surprise that we see indicators of clouds and hazes in the atmospheres of exoplanets. I should pause here and note that there are very different interpretations and definitions of what clouds and hazes are. An Earth scientists might have a different definition than an exoplanet scientists. I should therefore clarify, that I am using the definition given by the authors. In the most simple sense, a cloud is a “grey opacity source”. Imagine holding a prism up to a light and making a rainbow on your wall. If you were to take a plain, grey, no-color filter and hold it up between the prism and the wall, the only difference you would observe would be a subtle dimming across your entire rainbow. A homogeneous dimming of light (a grey opacity source).
Hazes can operate quite differently because they consist of tiny sub-micron sized particles, all capable of scattering light in various directions (called Rayleigh scattering). Ever wonder why the sky is blue? Rayleigh scattering is more efficient at short wavelengths (blue end of the spectrum), so the sunlight that gets scattered down to the earth is predominantly blue. Going back to our prism analogy, if you now replaced the grey filter with a dense mat of tiny sub-micron sized particles, you’d see the blue end of the rainbow increase in intensity.
Let’s return to Figure 1. Hazes should present themselves as a systematic increase in intensity toward the blue end of the spectrum and clouds should present themselves as a dimming throughout the entire spectrum. WASP-12b clearly exhibits a large presence of clouds while, WASP-31b all the way down to WASP-6b exhibit some degree of hazes.
What did we learn?
From just looking comparatively at the spectra of these ten planets, some fundamental questions about planetary systems can be addressed:
- A muted water feature, does not necessarily mean the atmosphere is depleted of water vapor. Instead, it is more likely an indicator of clouds.
- Not ALL hot Jupiters have a massive cloud deck
- Not ALL hot Jupiters have thick hazes
We have placed ten dots on our exoplanet HR diagram and laid the ground work for how future missions such as the James Webb Space Telescope, can add to the field. In the near future we will be able to double, quadruple or even centuple this sample size and gain a deeper understanding of planet atmospheres, atmospheric chemistry, planet formation.
Thank you very much for the explanation. I don’t quite understand the prism analogy in this instance: If the haze scattering is more efficient at blue, wouldn’t we see the blue end of the rainbow decrease in intensity? Because when scattered less light will follow the original exit path. So I understand that the blue end of the rainbow would spread over a larger area without enhancement. Is that what you meant?
What is shown in Figure 1. is not the intensity, but sort of the “shadows” for different colors (so called transmission spectra). You are right about scattering being more efficient at blue, and that’s why the “shadow” at blue is larger.