Title: Discovery of an Enormous Lyα Nebula in a Massive Galaxy Overdensity at z = 2.3
Authors: Zheng Cai, Xiaohui Fan, Yujin Yang, Fuyan Bian, J. Xavier Prochaska, Ann Zabludoff, Ian McGreer, Zhen-Ya Zheng, Richard Green, Sebastiano Cantalupo, Brenda Frye, Erika Hamden, Linhua Jiang, Nobunari Kashikawa, Ran Wang
First Author’s Institutions: UCO/Lick Observatory, University of California; Steward Observatory, University of Arizona; Hubble Fellow.
Status: Submitted to ApJ.
Lyman alpha (Lyα) line is perhaps the most popular spectral line in astrophysics. It helps to demystify reionization, to pin down the age of the Universe when reionization occurred, to measure redshifts of galaxies, and to trace the distribution of gas across the history of time. The Lyα emission line is adored by astrophysicists because of its brightness, it could be detected from distant galaxies when other spectral lines are too dim to work with.
When we look up to the sky, astronomers found extended blobs of Lyα emission, we call them Lyα blobs or Lyα nebulae. Why are they so important? We can get an idea by measuring their sizes – typically few tens of kpc across. Does it ring a bell? This is the size scale for our Milky Way Galaxy – Lyα nebulae are believed to be galaxy formation seen in action! They shed light on (pun intended) the formation of the most massive galaxies and the early interactions (e.g., dumping out newly-created chemical elements) with their surroundings.
Today’s paper reports the discovery of the biggest and the brightest Lyα nebula to-date, its name is MAMMOTH-1 at redshift of 2.32 (yes, it is giant and pre-historical). Let’s first go over some of its beautiful observational data! Figure 1 shows the image of the Lyα emission of MAMMOTH-1. It is humongous and bright. The angular extent of 53″ (shown in red arrows) translates to an end-to-end physical size of ~450 kpc! The Lyα-only luminosity of MAMMOTH-1 is estimated to be about 10 times the bolometric (all-wavelength) luminosity of the Milky Way! It’s really bright!
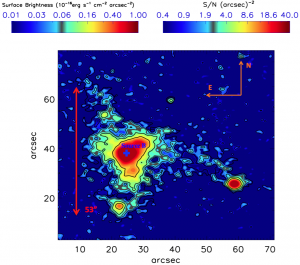
Figure 1. Lyα image of MAMMOTH-1. The color map and contours denote the surface brightness (i.e. brightness of the Lyα line per sky area, left color bar) and the signal-to-noise ratio (how good the data is, right color bar). The red arrows show its estimated spatial extent. We also see Lyα emission in the North-East direction (top left on image), which could be tracing the filamentary structures of cosmic structure formation! (Figure 2 of original paper).
For comparison, in Figure 2 the authors put MAMMOTH-1 on the size-luminosity plane together with other Lyα nebulae found in the literature. The red circles are for MAMMOTH-1, clearly it lies in the extremes!
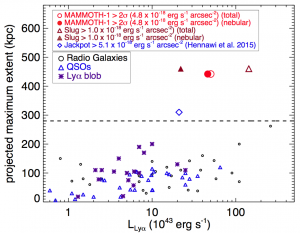
Figure 2. Physical extent versus Lyα luminosity comparison for MAMMOTH-1 and other Lyα nebulae found in the literature. The ‘nebular’ luminosity is distinguished from the ‘total’ luminosity by subtracting the light from the central point source, typically a black hole. ‘Nebular’ luminosity is more meaningful to be compared because it isolates the Lyα emission from the gas. (Figure 6 of original paper).
The authors took a spectrum of MAMMOTH-1 centered at the blue cross in Figure 1, shown in Figure 3. Besides the strong Lyα line, there are also spectral lines from He II (singly ionized helium), C III and C IV (doubly and triply ionized carbon).
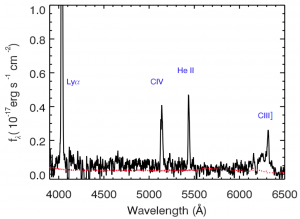
Figure 3. Spectrum of MAMMOTH-1. We see strong lines from Lyα, He II, C III and C IV. The red dotted line represents the error of the spectrum. We see that the peaks of the lines are a lot higher than the red line, it means the quality of the data is really good! (Figure 3 of original paper).
Zooming into the spectral lines in Figure 3, the authors found that the Lyα, He II, and the C IV lines are all double-peaked, examples from Lyα and He II are shown in Figure 4. The black curves are the observed spectra, the blue and the red curves are the estimated blue-shifted and red-shifted components. The 2D spectra show that the He and C line emission are also extended (~20 – 30 kpc).
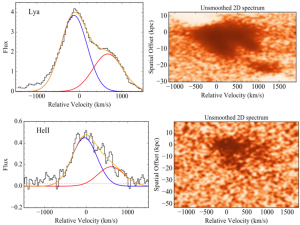
Figure 4. The Lyα and He II spectra of MAMMOTH-1. The left column is the zoomed-in view of the line profiles in Figure 2. Note that the wavelength axes have been rescaled to show the doppler shift of the lines. The right column is the so-called 2D spectra of the corresponding Lyα and He II lines – basically the spectra is dispersed in the vertical axis to show the spatial extent of the line emission. (Figure 5 of original paper).
We still do not understand fully what powers Lyα nebulae. With fine observations like the above, it will be instructive to see what they can teach us. Below I am listing the proposed mechanisms for creating extended Lyα emission, let’s go through the checklist to see how well they match the current observations.
- Fluorescent light
- Idea: Energetic radiation from the central black hole ionizes the gas around it, Lyα is generated when the extended ionized hydrogen gas recombine and de-excite towards the ground state.
- Agree with data?: Yes. Spectral line ratios are consistent with simulated data assuming a central powerful black hole.
- Resonant scattering
- Idea: Lyα is very easily absorbed by neutral hydrogen. Once produced, they are scattered (absorbed and re-emitted) many times before they make their way to our telescopes. The scattering process disperses the Lyα emission into an extended blob.
- Agree with data?: Not quite. The He line is not a resonant line so it doesn’t experience scattering as Lyα does. It means that He shouldn’t have a double-peaked feature. The common double-peaked profile of He and Lyα points to an alternate pathway (see below).
- Gravitational cooling
- Idea: When gas falls into a growing galaxy, it heats up. Such heating excites hydrogen atoms, Lyα photons are generated when the atoms de-excite.
- Agree with data?: Not quite. The 30 kpc extent of He emission is inconsistent with prediction from this picture.
- Shock heating by outflows
- Idea: Intense star formation or jets from the central black hole of the galaxy could launch strong outflows. The shock could heat up an extended region around the center which energizes the extended Lyα emission.
- Agree with data?: Yes. The common double-peaked profiles, the observed line ratios, and the extent of line emission are all compatible with the outflow model.
Therefore, the current data support the fluorescent and the galactic outflow models. To me, the most intriguing aspect of astrophysics is the magnificent combination of careful measurements and theoretical justification, today’s paper is a grand demonstration of this. With more and more passionate researchers joining the field, our journey of learning about the Universe will just get better and better.


Thanks Benny for bringing such an excellent summary