Title: A Gap in the Lower Main Sequence Revealed by Gaia 2 Data Release
Authors: Wei-Chun Jao, Todd J. Henry, Douglas R. Gies, and Nigel C. Hambly
First Author Institution: Georgia State University
Status: Accepted to ApJL
By this point you have probably heard of Gaia, ESA’s amazing instrument that has cataloged over a billion stars, providing unprecedented precision in parallax measurements. Since its second data release in April, tons of discoveries have already been made (here and here and here). Several of these have been made by creating a simple HR diagram (HRD) of Gaia’s stars.
Because parallax information allows for distance measurements (which are needed to calculate luminosity), Gaia has been a great resource in studying the HRD. In today’s paper, the authors discover and explore a strange feature of the Gaia HRD concerning low-mass, M type stars.
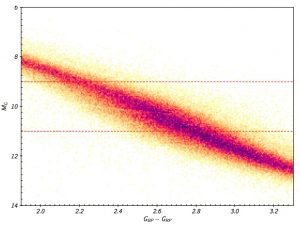
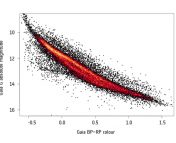
Figure 1: The observational HRD for selected Gaia stars within 100 pc. The gap can be seen between the two red dotted lines that mark absolute G magnitude = 9 and 11. The gap is more prominent in the blue, showing that low metallicity stars deepen the feature.
Mind the Gap
Take a gander at Figure 1. Can you see the low-density gap between the two dotted lines? That’s the aforementioned strange feature and topic of today’s paper. The authors found this unexpected detail by simply selecting a 100 pc sample from Gaia and removing some low quality sources. The portion of the HRD shown in Figure 1 is comprised of main-sequence M stars, and the gap cutting through this portion occurs at about 
Before figuring out why the gap exists, the authors had to make sure it was real, i.e., not some sort of artifact from the Gaia data. So they matched the stars surrounding the gap to 2MASS sources, and remade their HRD with near-infrared colors. As you can see in Figure 2, the gap is still present. So whatever is going on, it is persistent in both optical and infrared colors. Even when testing for stars out to 130pc, the gap suspiciously remains.
So what could be causing the lack of stars in this narrow (but significant) region? And why are we just now finding it?
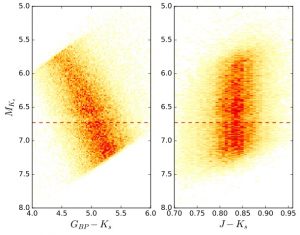
Figure 2: Two HRDs shown using 2MASS colors. The gap can be seen above the red dotted line, which marks the absolute magnitude (in the 2MASS K band = 6.73) associated with 0.35 solar masses..
The reason that no one has seen this feature before is quite simple. Before Gaia, there simply were not enough M stars with reliable parallax information to illuminate this subtle gap. As for the cause of the gap, the authors have offered up a culprit.
So What Could it Be?
Around spectral type M3.o (and later) the star becomes fully convective, whereas earlier M types have an outer convective envelope with an inner radiative zone that separates the envelope from the convective core, a.k.a the chewy chocolately center. (Ok, this is nothing like a Tootsie pop, but I stand by my visual). The authors have proposed that the gap they discovered is related to this transition from partially to fully convective.
The evidence is pretty convincing that this gap is due to a sudden change in the structure of the M stars that define it. Theoretical models show that this transition from partially to fully convective should happen around 0.35 solar masses, which corresponds to a certain magnitude (varying depending on wavelength) according to mass-luminosity relations. The authors explore this concept using isochrones (curves on the HRD that represent stars of the same age), and alas, the gap occurs very very close to this theoretical marker mass.
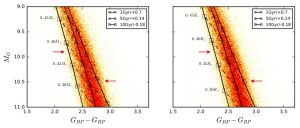
Figure 3: PARSEC isochrones as denoted in the legend for different ages and metallicities. The dashed lines represent lines of equal mass (left) and radius (right). The red arrows mark the beginning and end of the gap. The authors note that perhaps the shallower slope of the gap as opposed to the equal mass/radius lines is due to various metallicities of the HRD M dwarfs.
Follow-up Findings
Several studies have already been conducted to explore this proposed cause, basically concluding that “Yes, the gap is due to this convective transition, but it’s not that simple.” (Not a direct quote, by the way).
Macdonald & Gizis (2018) explain that the process responsible for the gap is the merging of the convective envelope and core as the star becomes fully convective. The stars above a certain mass (this varies depending on who you ask), and therefore above the gap, do not merge their core and envelope, thus staying partially convective. Those below a certain mass (or below the gap), are fully convective before they ever reach the main sequence. But stars in a mass range of 0.315-0.345 solar masses (or 0.34-0.36 if you ask Baraffe & Chabrier (2018)) merge their core and envelope while on the main sequence.
The mechanism at play here has to do with the abundance of 
Whoever you believe (you may want to read the papers and decide for yourself), one thing is for certain. There is a lack of M stars in a certain little sliver of the Gaia HRD, and it’s weird. Astronomers have established that this decrement is due to a population of M stars changing from partially to fully convective while on the main sequence. The core and envelope of said stars becoming one seems to be the process responsible, but the exact details are up for debate. Here’s to hoping that more will be revealed.


Thank you for this article. It’s interesting to see how the HR diagram is still helping to uncover new phenomena. I assigned it to my astronomy students to read!