Authors: C. Georgy, C. Charbonnel, L. Amard, N. Bastian, S. Ekström, C. Lardo, A. Palacios, P. Eggenberger, I. Cabrera-Ziri, F. Gallet, N. Lagarde
First Author’s Institution: Department of Astronomy, University of Geneva, Versoix, Switzerland
Status: Accepted for publication in A&A [open access on arXiv]
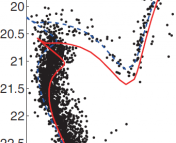
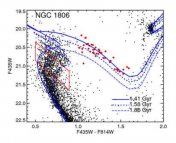
In a previous astrobite, I wrote about the curious phenomenon of extended main sequence turn-off (eMSTO) seen in young and intermediate age stellar clusters. The eMSTO is a feature in the color-magnitude diagram (CMD) of these clusters where the main sequence turn-off looks unusual – far more spread out than it should be for a normal set of stars with the same age. One possible reason for this phenomenon is stellar rotation and the findings I discussed last time supported that explanation.
In today’s bite, we will follow the thread even further. The main idea is this: if rotation causes the eMSTO feature, then removing it should make the feature disappear. That is why the authors of today’s paper investigate magnetic braking, which slows down rotating stars. Using many sets of rotating stellar models, they predict the cluster age when we should no longer see eMSTOs. If rotation is indeed the correct explanation, their predictions should agree with observations. Read on to find out whether or not they do!
What does rotation do, exactly?
Before we start messing around with rotation rates, let’s talk about how rotation affects the evolution of a star and therefore the star’s location on the CMD . There are three distinct effects relevant to the problem at hand:
- Hydrostatic effects – Since rotation adds centrifugal support, a rotating star behaves likes a non-rotating star of lower mass. It will have a lower effective temperature i.e. look redder on the CMD.
- Mixing effects – Rotational mixing of chemical species into the core can be efficient or inefficient depending on your models. When it is efficient, the core is refueled with hydrogen and its mass increases. Having more hydrogen to burn increases the main sequence lifetime of the rotating star compared to the non-rotating case. The rotating star will also appear brighter at the end of its main sequence life.
- Viewing angle – If the star is rotating fast, it will not have the same temperature and brightness everywhere. If you look at it from the polar direction, it will look hotter (bluer) and brighter. But if you look at the star from the equatorial direction, it will look cooler (redder) and fainter.
This is why rotation can lead to a spread in the MSTO on CMDs, moving stars around in color or magnitude based on their rotation rates.
How does braking change the picture?
Magnetic braking happens due to the interaction of stellar winds with the surface magnetic field of the star. This effect is more efficient for lower mass stars. Now, if a cluster is old enough, most stars at the eMSTO will be low mass stars because massive stars tend to live fast and die young. These low mass stars are going to be slow rotators, having experienced significant magnetic braking early in their lives on the main sequence. So, for clusters that are old enough, rotation should have minimal effect on the MSTO and it should look narrow and normal.
Results, results, results!
The authors use two sets of stellar models computed using two different stellar evolution codes (STAREVOL and GENEC), at three different metallicities. This gives them a handle on how robust their results are as well as how things change with metallicity.
In Fig 1, the left panel shows the ratio of the surface angular velocity to the critical velocity (break-up velocity) over time. The critical velocity is the surface velocity beyond which the star would start ejecting matter from its surface. Hydrogen burning has been used as a proxy for time evolution in this plot because the relative amount of hydrogen in the core drops over time. If the velocity ratio decreases over time, this means the star is rotating slower due to magnetic braking. We can see that the two lowest mass models are braked quite early in their evolution and end up rotating slowly. Beyond 1.5 solar masses, the models are not braked at all. The right panel shows the evolution tracks for the same models on the color magnitude diagram. The dashed lines in this panel show the standard, non-rotating tracks. We can see that for the lowest two masses, the tracks for rotating and non-rotating models are almost identical. For the higher mass models, the rotating tracks look notably different, with longer main sequence lifetimes.
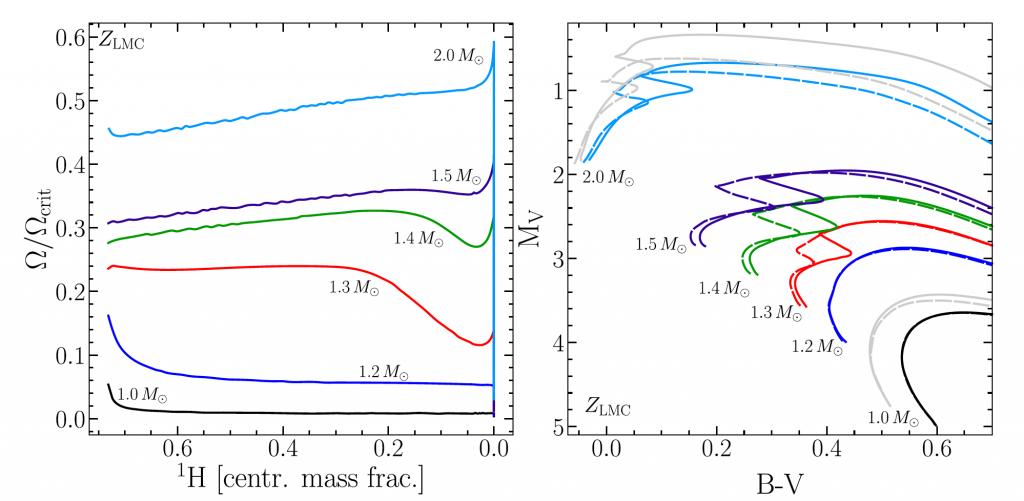
Fig 1. The left panel shows the ratio of rotational velocity to critical velocity for stars of different masses, as a function of the hydrogen mass fraction at the center of the star (proxy for time evolution). The right panel shows the tracks of the same stars on a color-magnitude diagram. Dashed lines are non-rotating models and all calculations have been done at the Large Magellanic Cloud (LMC) metallicity. Figure 1 in the paper.
In Fig 2, we can see a comparison of STAREVOL and GENEC isochrones (curves connecting stars of the same age) at the same metallicity in the left and middle panels. One set of isochrones shows an age where a large eMSTO is expected and the other set shows a much older age where the eMSTO is expected to disappear. Sure enough, there is almost no difference between the rotating and non-rotating tracks for the older cluster. The right panel shows GENEC isochrones for an older cluster but at a different metallicity. Once again, there is no eMSTO.
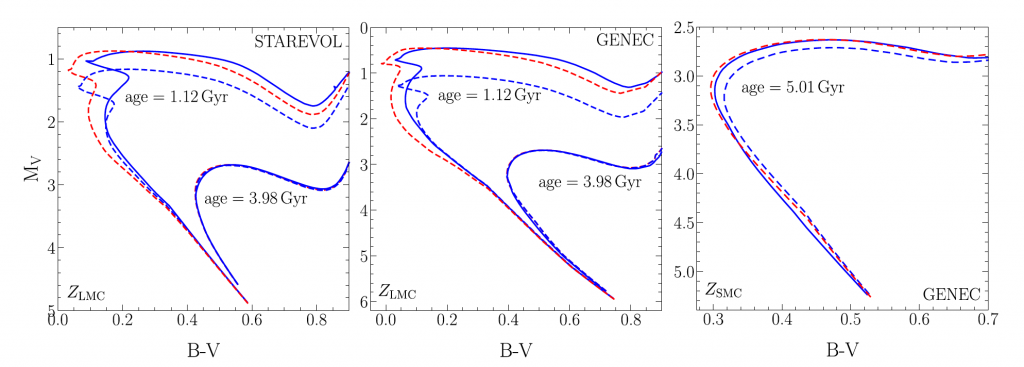
Fig 2. Isochrones at LMC metallicity for STAREVOL (left) and GENEC (middle) models. Isochrones at the Small Magellanic Cloud (SMC) metallicity for GENEC (right) models are also shown. Blue curves show isochrones for the rotating (solid) and non-rotating (dashed) cases. The red dashed curves represent non-rotating isochrones with a turn-off luminosity that is closest to the rotating ones. Each set of isochrones corresponds to a particular age. Figure 3 in the paper.
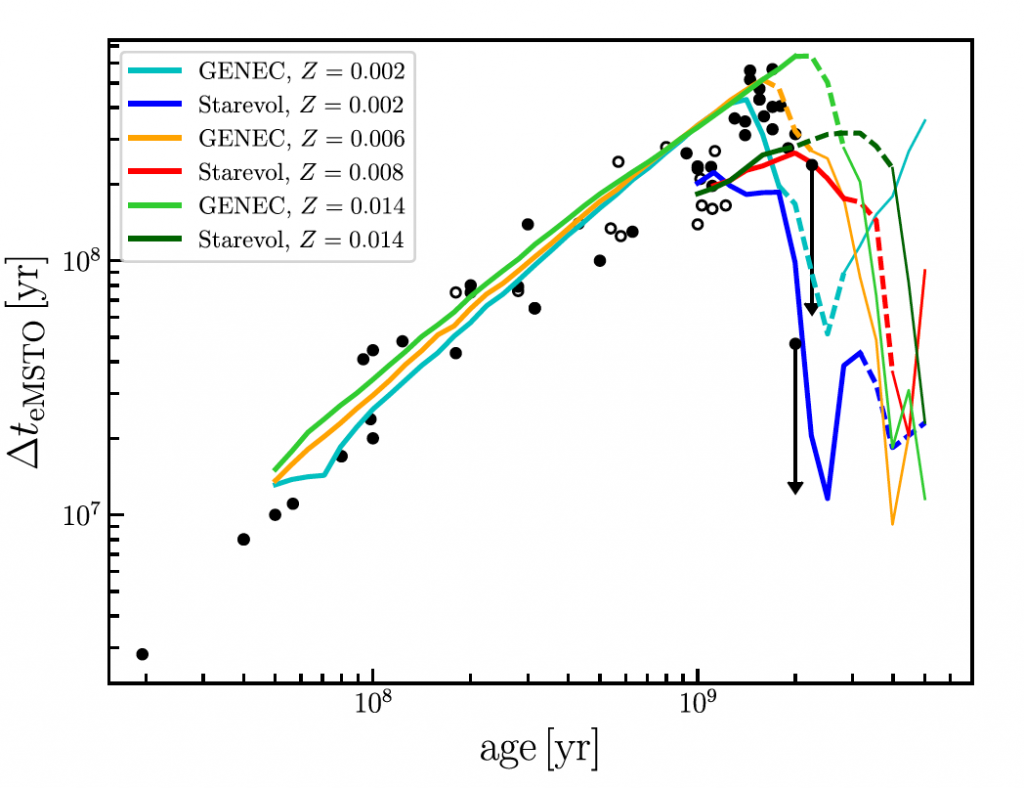
Fig 3. The circles represent clusters for which an eMSTO has been observed, either Galactic (open circles) or in the LMC (filled circles). The coloured curves are results from the simulations at three metallicities for both stellar evolution codes. Figure 4 in the paper.
Finally, let’s take a look at the observational data. In Fig 3, the eMSTO spread is plotted as a function of the age of the cluster. The solid lines are model predictions and they fit the data points beautifully. The spread increases linearly till about 1-2 Gyr and then vanishes! The exact age at which this happens increases with increasing metallicity of the models used.
These results offer further support to the claim that stellar rotation is a key ingredient in causing eMSTOs.