Title: Visualization of the challenges and limitations of the long-term sunspot number record
Authors: Andrés Muñoz-Jaramillo and José M. Vaquero
First Author’s Institution: SouthWest Research Institute, High Altitude Observatory, and the National Solar Observatory, Boulder, CO, USA
Status: Published in Nature Astronomy; closed access
The solar magnetic field is continuously reshaped and regenerated through a process known as the solar cycle, or the periodic variability of the Sun’s magnetic activity on an 11 year timescale. Although this cycle repeats every 11 years, the intensity of solar radiation (which is strongly coupled to the overall magnetic activity), changes from cycle to cycle. The change in solar irradiance, or the amount of sunlight we receive here at Earth, is correlated with changes in Earth’s climate. Note: the warming trend observed since the 1980s is not caused by the Sun. The correlation between solar irradiance and its effect on Earth’s climate is of particular interest when the Sun goes through long periods of extremely low activity, the most notable of which is the Maunder Minimum which occurred between 1645 and 1715. Recent reexamination of historic solar activity data from the last 400 years has sparked further efforts to understand the abnormally low activity during the Maunder Minimum. Within this context, the authors of today’s paper focus on the limitations of using historical data to estimate and understand long-term solar variability (and events like the Maunder Minimum) and present a new way to visualize the current state of historic solar cycle data.
The Sol(spot) Cycle
The 11 year variability in solar magnetic activity is most easily traced by the presence of sunspots. Sunspots are strong concentrations of magnetic field in the solar surface that radiate strongly in ultraviolet (UV) wavelengths. While our atmosphere shields us from most UV radiation, changes in UV radiation from the Sun can still affect Earth’s climate. Throughout the solar cycle, sunspots change in number, with the most sunspots present at solar maximum. They also change in latitude, migrating from the poles towards the equator as the cycle progresses. Both of these phenomena are shown in Figure 1.
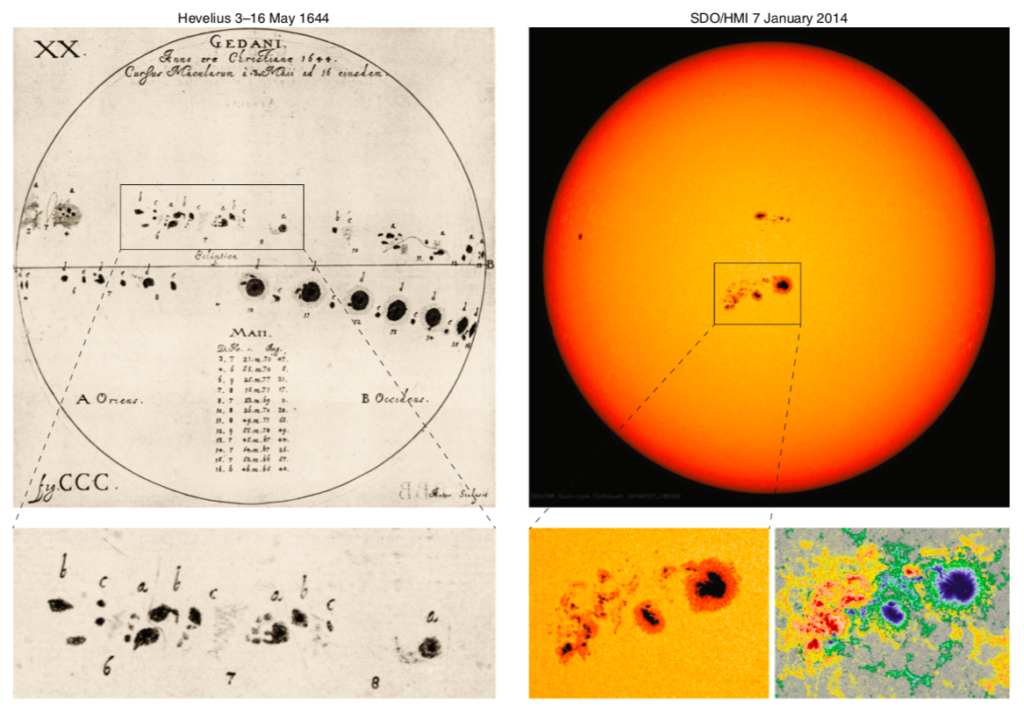
Drawings of sunspot observations first appeared around 1182 C.E, and written observations appeared as early as 800 B.C.E. However, continuous sunspot drawings which allow us to track the solar cycle didn’t appear until the early 1600s, during the time of Galileo (whose own drawings and letters are often referenced in long-term solar cycle analyses). A comparison between a typical historic sunspot drawing and a modern observation is shown in Figure 2.
Long-term sunspot observations eventually led to the discovery of the solar cycle in the mid-1800s, inspiring astronomers of the time to continue to monitor our closest star.
The Problem With History
Zooming ahead to present day, solar astronomers rely heavily on these historic observations to track long-term solar activity. However, there are many challenges that must be considered when using historic data, and current representations often fail to visualize their many sources of error (see Figure 3a). This (non-exhaustive) list of potential sources of error includes differences in telescope optics, a lack of uniform solar disk coverage, and difficulties in determining a standard observer. Prior to the mid-1800s, things get even trickier with an increase in observational gaps (see Figure 3b) and a lack of a common vocabulary used to describe the same phenomena.
In order to quantify sunspot data of historic solar observers, astronomers use two numbering schemes: the Wolf Sunspot Number (WSN) and the Group Sunspot Number (GSN). Named after Swiss astronomer Rudolf Wolf, the WSN uses a weighted average of observed sunspots and sunspot groups to quantify what was seen by an astronomer on a given day. In contrast, the GSN uses only the number of sunspot groups observed. Today’s paper focuses on creating better tools for visualizing the GSN over time, as it has the most raw historic data available.
Often, users of historic sunspot data are unaware of the incompleteness of the historic sunspot record (i.e. the GSN over time) and rely on data with numerous sources of error. While the authors describe many methods to reconstruct GSN observations, the primary goal of today’s paper is to present a new way of visualizing the current state of the sunspot number series in order to illustrate the challenges in using historic data.
A New Way to Visualize
The new GSN visualization is shown below in Figures 3c and 3d. In this, the authors combine previous measurements of the GSN series and their associated errors (shown in Figure 3a), thus highlighting the quality and abundance of sunspot data throughout different time periods. Figures 3c and 3d also outline the particularly speculative nature of understanding long term solar activity, as many current sunspot series fill in these gaps using various methods.
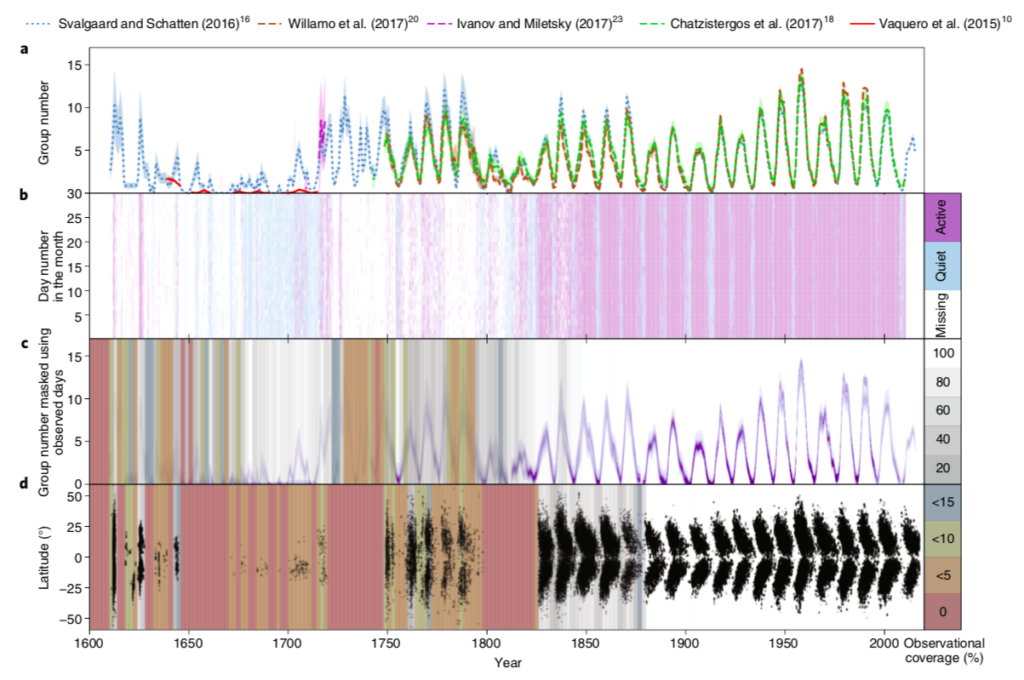
Figures 3c and 3d show the particular challenges in understanding the depth of the Maunder Minimum (the period between 1645 and 1715) and the transition from this period of low activity, as these are some of the least well-observed periods in the historic sunspot record. While the authors ensure that this is not a permanent fix to the challenges in reconstructing a long term sunspot number series, this new visualization provides a snapshot of the current state of mapping the solar cycle over the last few centuries. The authors note that as more historic data is uncovered, data calibration techniques improve, and more comparisons to other proxies of solar activity are used, the sunspot number series will improve.
The effort to reconstruct the sunspot number series remains a highly interdisciplinary one, requiring contributions from astronomers, historians, and philologists to effectively analyze the source sunspot drawings. Looking ahead, the authors are optimistic the next coming decade will see huge improvements in both our understanding of the long-term sunspot record and its uncertainty and the Maunder Minimum.


coriolis force thats what im looking at
the proper motion of the sun as it locomotion takes it through the milky way galaxy
and as it does the intergalactic gas moves across the equator region and the north goes clockwise and the south goes anticlock or is it the other way around and then they move over the tropics of the sun 30 degree latitude north and south
creating tornadoes cyclones hurricanes in the suns high corona sphere