Title: On the (Lack of) Evolution of the Stellar Mass Function of Massive Galaxies from z = 1.5 to 0.4
Authors: Lalitwadee Kawinwanichakij, Casey Papovich, Robin Ciardullo et al.
First Author’s Institution: Kavli Institute for the Physics and Mathematics of the Universe, The University of Tokyo
Status: Accepted for publication in ApJ
Before the great Shapley-Curtis debate in 1920, astronomers knew virtually nothing about galaxies outside our own. At this time, it was unclear whether there even were galaxies beyond the Milky Way. Today, the study of galaxy evolution is nearly a century old, and our understanding of the diversity of galaxies has grown exponentially. Our current cosmological model (LCDM) predicts nearly all that we observe on the largest scales, including the distribution of galaxies across the sky. However, a complete theory of the evolution of galaxies that explains all the complexity we observe (e.g., Figure 1!) has evaded us. Basic questions such as, “How do galaxies grow over time?” remain unanswered. We explore this very question in today’s Astrobite, featuring exciting new results regarding the evolution of galaxies in the past 9.5 billion years.
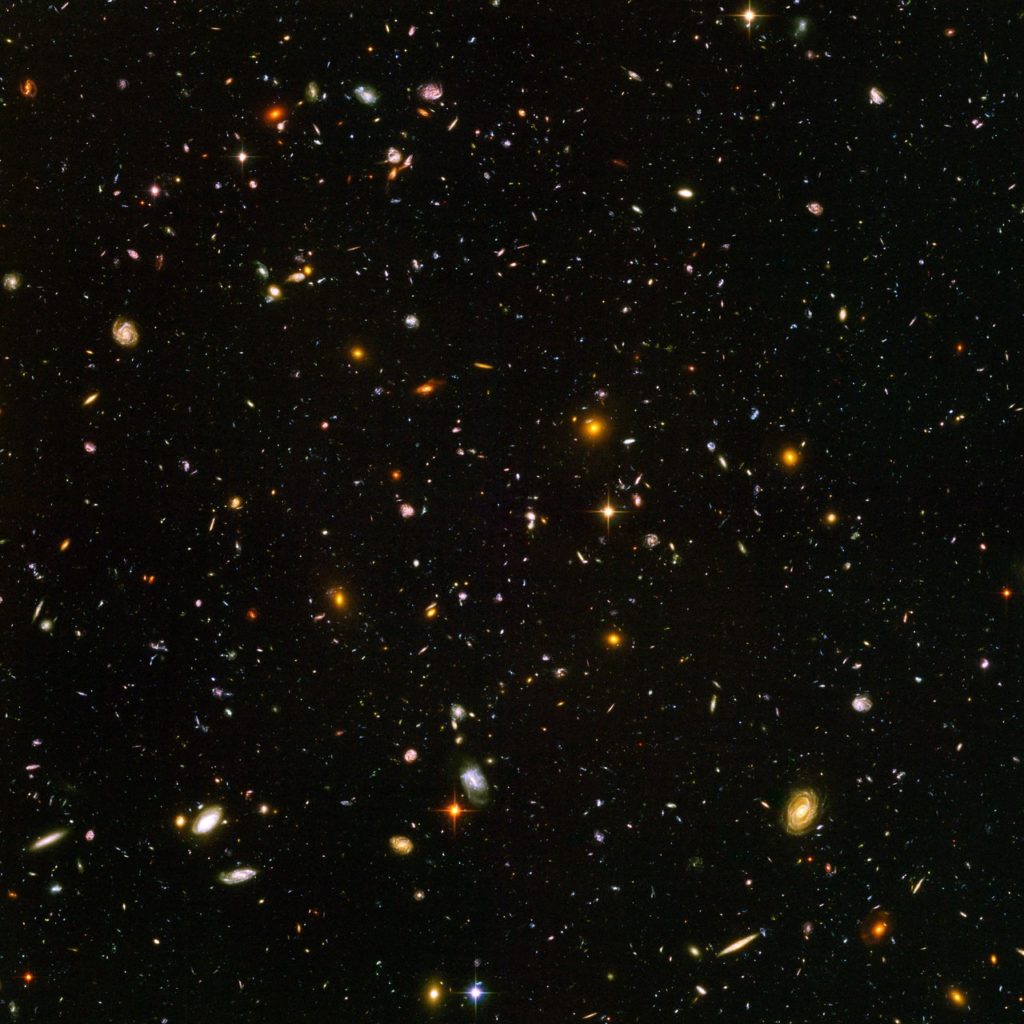
Figure 1: Pictured above is the famous Hubble Ultra Deep Field. In this image, more than 10,000 galaxies can be seen. Deep images like these reveal a timeline of cosmic proportion, probing billions of years of cosmic history. How did the diversity of galaxies we observe arise? Credit: NASA, ESA, S. Beckwith (STSci) and the HUDF Team.
Half a Million Galaxy Bash
On human timescales, galaxies hardly change at all. Spanning billions of years, evolutionary processes undergone by galaxies can only be investigated by studying ensembles of galaxies at different moments throughout the history of the universe. However, due to cosmic variance, obtaining a sample that accurately captures the complexity and intrinsic diversity of galaxies throughout the universe is no simple task. In this work, the authors make use of a uniquely large dataset provided by the Spitzer Space Telescope, the Hobby-Eberly Telescope Dark Energy Experiment (HETDEX), and NEWFIRM imaging, which altogether covers a 17.5 square-degree area of the sky in visible and infrared light. This joint area is known as the SHELA (Spitzer/HETDEX Exploratory Large Area) survey. Shown in Figure 2, SHELA overlaps with the well-known area of SDSS Stripe 82 , which has been studied in detail by other astronomers. What makes these data unique is the volume they span: the HETDEX data reach 24.5th magnitude, providing a sample of more than 400,000 galaxies out to z = 1.5 (when the universe was ~4.5 Gyr old), ultimately probing > 100 cubic-Mpc of comoving volume. With this, uncertainties introduced by cosmic variance are mostly mitigated.
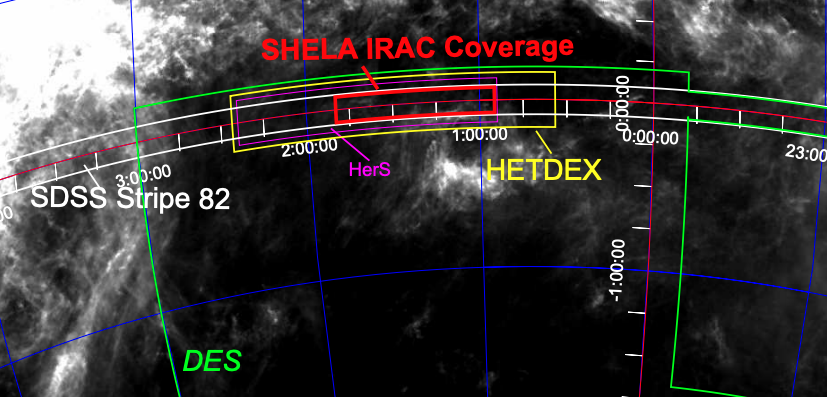
Figure 2: Spitzer-HETDEX Exploratory Large-Area Survey map (Papovich et al. 2016). Dust throughout the Milky Way is shown in greyscale. Areas from adjacent and overlapping surveys, like the Dark Energy Survey, can be seen throughout.
Handle With Care
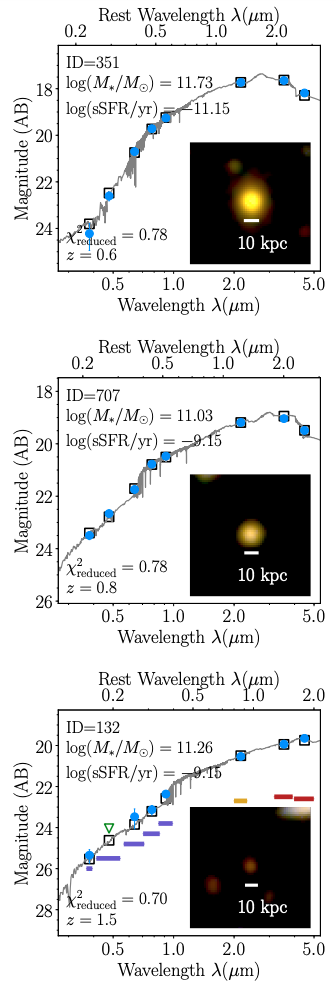
Figure 3: Representative galaxies from z = 0.6 to z = 1.5. Blue circles indicate measured photometry, while green triangles are upper limits. Overlaid are the best-fit SEDs from modeling along with color images of each source. The bottom panel also includes the detection and photometric completeness limits. In the upper-left corner, the stellar masses and specific star formation rates inferred from SED modeling are given.
For decades, astronomers have sought to measure the GSMF with ever increasing precision. The job is straightforward: detect galaxies, measure their redshifts and stellar masses, and see how the number densities change over cosmic time. Though the goal is simple to state, this is a Herculean task. Estimating the redshifts and stellar masses of galaxies through photometry requires modeling of the underlying galaxy spectral energy distribution (SED) with only a handful of data points that sample it. To infer the physical properties of galaxies through SED modeling, researchers compare the observed photometry with synthetic spectra created by simulating stellar populations and evolving them (these models are called, you guessed it, stellar population synthesis models). With limited information about the true SED, researchers must make assumptions in these models that have dramatic impacts on the inferred physical parameters of galaxies. The authors of this work take great care to investigate numerous possible evolutionary scenarios for galaxies in their samples, and examples of best-fit SEDs for sources at increasing redshift are shown in Figure 3.
With masses and redshifts for each galaxy, we can return to our original question: “How do galaxies grow over time?”
Gonna Change My Way of Thinking
A key finding of this work is shown in Figure 4, which shows the number densities of galaxies in four different mass intervals as a function of redshift. Each line indicates the measurement made when using a different set of models, and the grey region indicates the averaged result and associated uncertainty.
Between 1 < z < 1.5 (roughly 1.5 Gyr), the number densities of the lowest mass galaxies changes by a factor of a few; this is indicative of little growth. From z = 1 to z = 0.4, the story changes! Galaxies less massive than 1011 solar masses experience even less growth during this 4.5 Gyr period than between 1 < z < 1.5. Likewise, virtually no evolution is found for galaxies more massive than 1011 solar masses in this time window – the number densities of these galaxies remain roughly constant. So what does this mean? LCDM predicts that galaxies start small and grow hierarchically through major and minor mergers, so how is there so little growth in massive galaxies across more than 4 billion years? Let’s dig in.
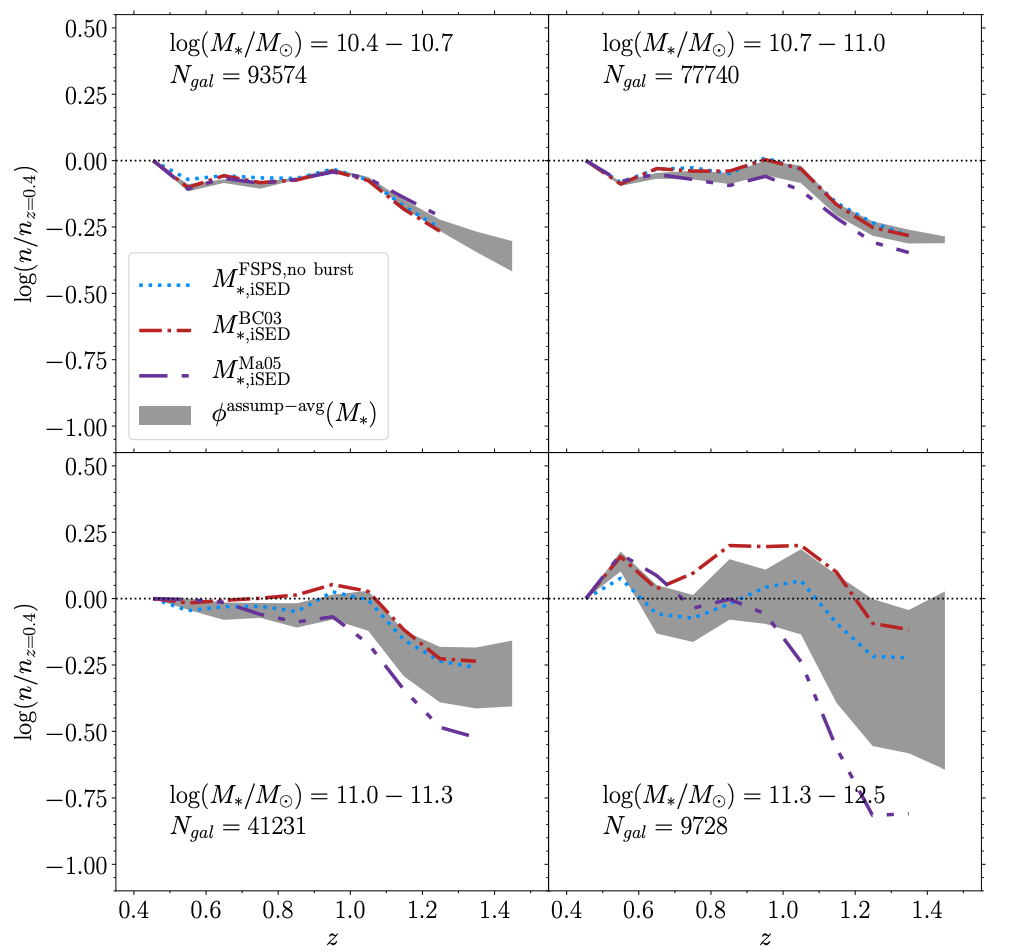
Figure 4: Evolution of the number densities of galaxies as a function of redshift (as a reminder, today is represented by z = 0, while z = 1.5 corresponds to 9.5 Gyr in the past). Four mass intervals of galaxies are shown, and the number densities are normalized to unity at z = 0.4. Each colored line indicates the measured evolutionary trend for a given set of stellar population synthesis models. The grey region indicates the average of each individual curve and the 68% confidence interval. The majority of evolution occurs between 1 < z < 1.5. Between 0.4 < z < 1, little evolution occurs for less massive galaxies, while the number densities of the most massive galaxies are consistent with no evolution at all.
Most massive galaxies at these redshifts are quiescent, no longer forming stars. These galaxies are dominated by old stellar populations, with many stars undergoing late stages of stellar evolution. In fact, during these late stages, a significant amount of stellar mass loss is predicted by stellar population synthesis models. Presumably, many of the remaining stars evolve up the red giant branch and asymptotic branch, where mass loss is common. Therefore, hierarchical growth through minor mergers are likely balanced by the mass lost through basic stellar evolutionary processes.
This result lies at an intersection between investigations carried out by other astronomers: there have been competing claims regarding the growth of massive galaxies since z = 1.5. However, with an immense volume of data and careful handling of systematic uncertainties, the results found by this team seem robust. In any case, our understanding of galaxy evolution will continue to flourish, thanks to upcoming missions involving new facilities like Euclid, WFIRST, and LSST, ongoing surveys using existing facilities like the Dark Energy Survey, and deep, wide field surveys such as the Hawaii Two-0 Twenty Square-Degree survey. Obtaining a rigorous theory of galaxy evolution is all but inevitable, and we will get there, one galaxy at a time.

Great job Lucas. Do you think the same phenomena goes on at the cellular level in biological systems? Thanks, Richard Reed, M.D.
Hi Richard! Which phenomena are you referring to?