Authors: Bluck, A., Maiolino, R., Piotrowska, J., Trussler, J., Ellison, S., Sanchez, S., Thorp, M., Teimoorinia, H., Moreno, J., and Conselice, C.
First Author’s Institution: Kavli Institute for Cosmology and Cavendish Laboratory – Astrophysics Group, University of Cambridge
Status: Accepted for publication in MNRAS
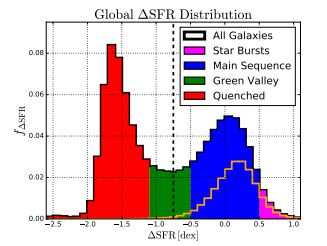
When astronomers look at galaxies in our universe, they found that they were usually either red or blue. Only a handful of galaxies lay somewhere in between, the so-called “green valley.” (If you’re wondering why it isn’t the purple valley, remember that green is between red and blue on a light spectrum.) Figure 1 illustrates this bimodal distribution in terms of star formation rate.
Hotter, younger stars give off more blue light, while cooler, older stars give off more red light. Galaxies that are still actively star-forming have younger stars and thus are bluer, while galaxies that have mostly shut-down star formation are redder. Galaxies that have shut down star formation are referred to as “quenched.” Stars form from the intergalactic gas, and if the quenching process were simply a matter of using up the gas over time, we would expect to see many more galaxies in the green valley.
Instead, some process must be quickly shutting down star formation, making the transition from blue to red relatively short on a cosmological timescale. This process has been identified as feedback from active galactic nuclei (AGN) and supernovae. These violent processes can create winds of material, heat up the surrounding medium and cause star formation to cease. However, the specifics of how quenching occurs still need to be hammered out, and the authors of today’s paper used a large survey of galaxies to gain some insight.
Inside-Out or Outside-In?
The tricky part of doing studies like this is actually measuring the rate of star formation. The star formation rate (SFR) is indicated by the strength of spectral emission lines. In the past, there would typically be only one spectra for an entire galaxy, meaning that only global star formation rates could be measured. This has changed with the advent of spectrally resolved surveys of galaxies, like MaNGA (Mapping Nearby Galaxies in APO). Spectrally resolved means that an image can be taken of the galaxy where every pixel has an associated spectra (these are called spaxels — spectral pixels). With spaxels, star formation rates can be measured for different parts of the galaxy.

The authors used this information to measure star formation as a function of radius. They also broke up their sample into two types of galaxies — centrals and satellites. Centrals are the most massive galaxy in their dark matter halo, while satellites are less massive galaxies that orbit the centrals in the same dark matter halo.
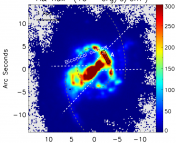
The radial profiles of SFRs are shown in Figure 2 for both centrals and satellites. The black dotted line indicates where the star formation rate is low enough to be considered quenched. Galaxies in the green valley are in the process of quenching and are the most interesting to look at when determining how quenching happens. For the central green valley galaxies, the center of the galaxies are quenched, while the outer regions are still star forming. This indicates that quenching is happening from the inside and moving outward. For satellites, the center is still largely quenched, but the outer regions are also subdued in star formation. This indicates that the satellites may have both inside-out quenching and outside-in quenching.
What causes the difference?
The authors sought to find out why there was a difference in the quenching mechanisms of the two different populations of galaxies. When they looked at the radial profiles for the low-mass and high-mass satellites separately, they found that the higher mass satellites had a radial profile that looked much more like the centrals, quenching from the inside-out, while the lower mass satellites were mostly being quenched outside-in.
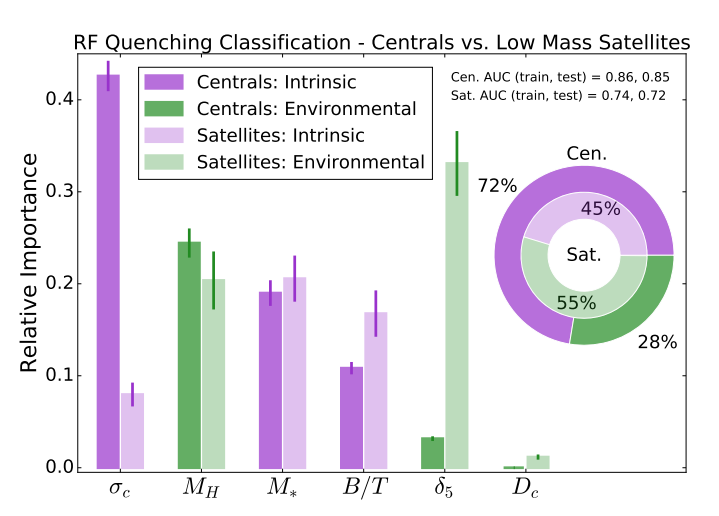
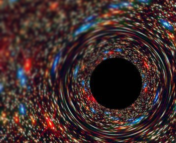
They then looked at different parameters to see which were more likely to predict whether a galaxy was quenched or not. This was done using a random forest classifier, a type of machine learning algorithm. A summary of the results can be seen in Figure 3. For central galaxies, the left bars, the most important parameters for predicting quenching were intrinsic, and all correlated with the most important parameter: central velocity dispersion (σc). The central velocity dispersion has been shown to be directly correlated with the mass of the central black hole. This black hole is the power source of the AGN, so it can be inferred that the larger the black hole, the more powerful the AGN feedback will be.
For the lower mass satellites, shown in the right bars, the most important parameter for determining quenching is environmental — the local galaxy over-density (δ5), a measure of how close the satellite is to other galaxies. For lower mass satellites without powerful AGN, their quenching is determined by external factors, like galaxy-galaxy harassment, which is pretty much exactly what it sounds like: galaxies passing by and disrupting each other. This explains why satellite quenching starts from the outside and moves inward.
When the radio plays metal
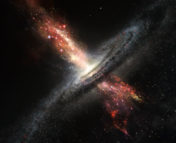
In this opus of a 40-page paper, there was one more question that the authors wanted to explore — which mode of AGN feedback was most important? There are two main ways AGN can shut down star formation: radio mode, where jets from the AGN heat up the gas that surrounds the galaxy and prevents it from cooling and condensing onto the galaxy where it can then form stars, and quasar mode, where the AGN creates winds that push gas out of the galaxy, preventing new stars from forming.
The gas inside a galaxy is enriched by metals created from the deaths of stars, while the gas that surrounds a galaxy is made up of more primordial elements: hydrogen and helium. If quenching occurred mainly through the quasar mode of AGN feedback, metals would be carried out in the outflow and wouldn’t be around to form stars. If quenching occurs through the radio mode, however, the galaxies would not have fresh supplies of hydrogen and helium and the newest stars would be forming with the more enriched gas that remains in the galaxy. In figure 4, the authors plot the metallicity (or how metal-enriched stars in a galaxy are) for galaxies of different masses. The trend is clear: quenched (red) and quenching (green) galaxies have higher metallicity than actively star-forming, main sequence (blue) galaxies. Thus, the authors conclude that AGN feedback operates primarily through the radio mode.

This paper is a really important step on the road to discovering how galaxies transition from star forming to quenched with little star formation, which has been a big question for decades. The next steps will be comparing these results to what has been found in simulations and then updating our models of feedback to better match what has been observed.