Authors: Rohan P. Naidu, Jorryt Matthee, Pascal A. Oesch, Charlie Conroy, David Sobral, Gabriele Pezzulli, Matthew Hayes, Dawn Erb, Ricardo Amorín, Max Gronke, Daniel Schaerer, Sandro Tacchella, Josephine Kerutt, Ana Paulino- Afonso, João Calhau, Mario Llerena and Huub Röttgering
First Author’s Institution: Center for Astrophysics, Harvard & Smithsonian, Cambridge, MA
Status: Submitted to MNRAS
The Epoch of Reionization (EoR) is a significant milestone in the history of the Universe. During this early period, which ended about 1 billion years after the Big Bang, some of the first stars and galaxies produced bright bubbles of energetic photons. Then, as the authors of today’s paper put it, these young stars “[ionized] the vast oceans of neutral Hydrogen (HI) they were born within”, separating neutral Hydrogen gas particles into charged protons and electrons. While we know fairly well when this epoch occurred, a major puzzle of reionization is how it happened: what sources produced enough high energy photons to ionize the entire universe so quickly, and what do those sources look like? Was it from a large population of common, faint galaxies (“democratic reionization”), or from a subset of rare, bright galaxies (“reionization by oligarchs”)?
To solve this puzzle, astronomers have developed a variety of tools and parameters that can be used to characterize the process. In today’s paper, the authors focus on the escape fraction (fesc), the fraction of ionizing photons that can escape their original galaxies and ionize the surrounding medium. The escape fraction provides clues about the speed and duration of reionization, as well as the size and geometry of ionized regions. These ionizing photons are in the Lyman Continuum (LyC) portion of the electromagnetic spectrum, at energies higher than the minimum energy a photon must have to completely ionize Hydrogen. These LyC photons travel through their galaxy as if in a pinball machine, bouncing off and getting absorbed by gas and dust particles along their path. However, a portion of these photons may manage to escape the galaxy pinball machine and ionize Hydrogen gas outside of the galaxy: we call these galaxies LyC leakers.
Fighting the fog
However, in order to measure LyC and quantify fesc, we’re faced with a major challenge: all the stuff in between our telescopes and distant galaxies acts as a fog dimming the emitted light. When we detect (or fail to detect) these photons, we have to ask: is this the galaxy’s true brightness, or are we looking through a semi-opaque veil of dust and gas in the way? Today’s paper gets around this issue by using resolved Lyman-alpha emission lines from galaxies called Lyman-alpha emitters (LAEs) to measure fesc, focusing on distant galaxies (at redshift z~2) slightly after the EoR. As opposed to LyC, Lyman-alpha line profiles aren’t impacted by the obscuring fog along our line of sight. Another benefit of using LAEs is that unlike LyC leakers and other analogs for reionization sources (for example, nearby star-forming galaxies), they’re fairly consistent over time, so a later LAE (for example, at z~2) can be directly compared to an LAE at the EoR (z~6). (See this Astrobite for more on early LAEs!)
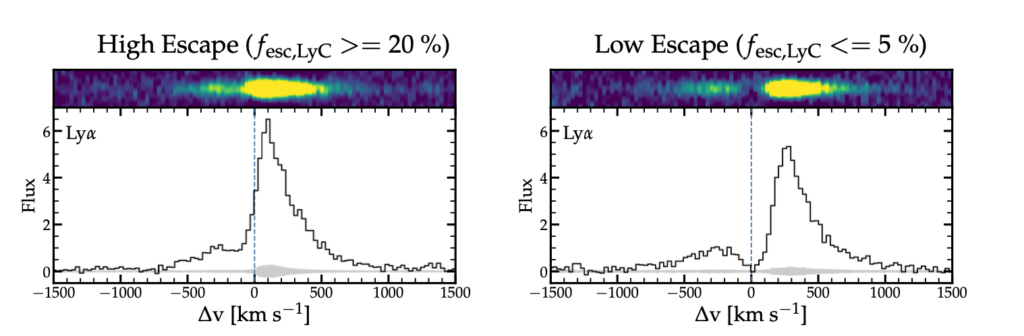
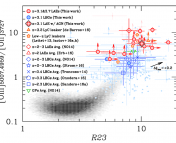
The project leverages an observational program called X-SHOOTER Lyman-alpha survey at z=2 (XLS-z2) which uses the Very Large Telescope in Chile to take spectroscopic data of a sample of galaxies with the advantage of wide wavelength coverage (300-2500 nm) and high resolution. Today’s paper analyzes a sample of 26 LAEs that were separated into “high escape” leaker and “low escape” non-leaker categories, with the goal of placing galaxies in broad, complete fesc bins and then comparing those two distinct stacks (see Figure 1). This information helps answer key questions about galaxy topography and holey-ness. If the material in the galaxy is porous, Lyman-alpha photons escape with minimal scattering, producing Lyman-alpha lines with narrow, tightly separated red and blue peaks. On the other hand, dense gas with fewer holes forces Lyman-alpha photons to scatter, creating a broad line profile.
Four phases for star-forming galaxies
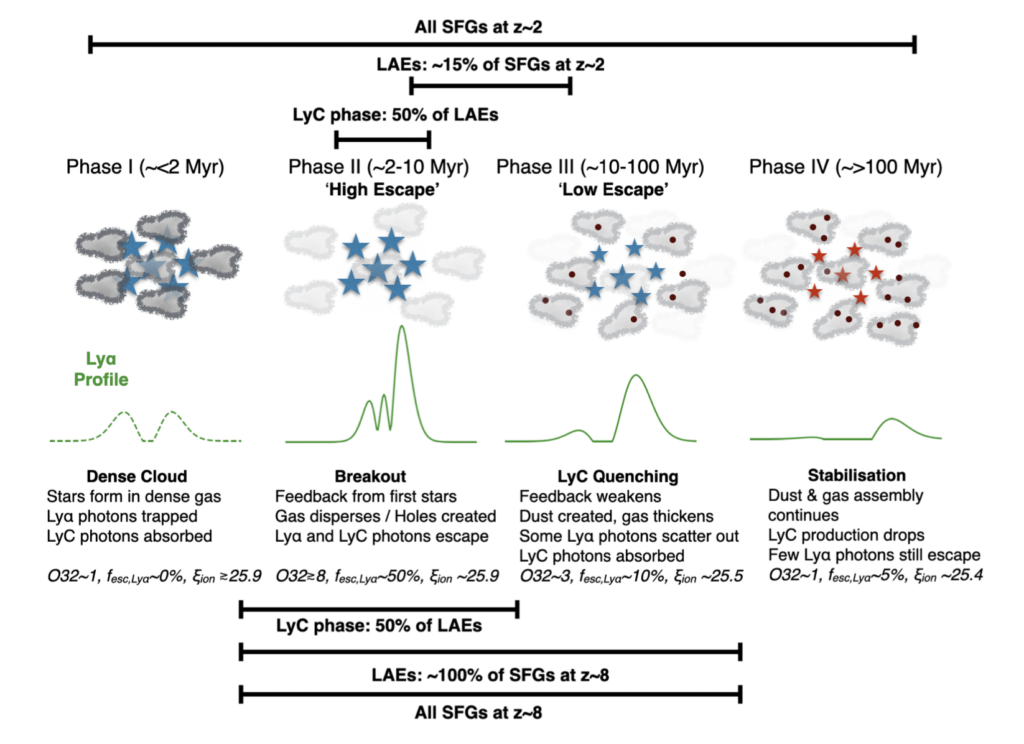
With this analysis, the authors extrapolate their results to the EoR. They explain the process in four phases (Figure 2) of a distant star forming galaxy (SFG). In Phase I, the source is a dense cloud, which hosts forming stars. The Lyman-alpha photons are trapped in the cloud while the LyC photons are absorbed by the material. Here, the escape fraction is zero. Next comes Phase II, when feedback from those stars creates holes in the cloud and allows both Lyman-alpha and LyC photons to escape. This is the LyC leaker phase, and the beginning of the LAE classification, with high escape fractions ~50%. Phase III corresponds to the low escape sample with fesc ~10%. As the feedback weakens and the dusty byproduct of star formation is created, some Lyman-alpha can escape but most of the LyC leaking ceases as those photons are absorbed in the cloud. Lastly, Phase IV wraps up the process as things begin to stabilize and fewer energetic photons are able to escape.
A useful tool to probe reionization
The authors characterize LyC leakers as galaxies that have had recent (<10 Myr) episodes of vigorous star formation, hosting super star clusters that carved out holes in the galaxy’s material, clearing paths for ionizing photons to escape and leak out. A crucial point they emphasize is that copious amounts of photons need to be emitted at the right time, with photon production and escape occuring in sync. In contrast, non-leakers may have strong emission but also contain dusty, opaque material in the way that wasn’t cleared by feedback from young massive stars. The authors conclude by emphasizing that since LAEs don’t vary much over spacetime, they’re a useful tool to infer properties of more distant galaxies at the EoR.
Astrobite edited by James Negus
Featured image credit: Amstill Roofing (leaking ceiling image) & https://reionization.org/science/ (reionization schematic)
Check out this Twitter thread covering the paper by the first author, Rohan Naidu!
i need a trade off before you read this
0000 to 2 million years out from the reionization
what size are you making the universe
what is your figure 1 light years 10 ly 100 ly 1000ly 10,000ly 100,000ly 1,000,000 ly 10,000,000 ly 100,000,000 ly 1,000,000,000 ly 10,000,000,000 ly or 100,000,000,000 ly or what dimension do you make it
your paper plus my impression states
0000 to 2 million years phase 1 all star forming galaxies at z-2 = non leakers
population iii young bright stars parent generation in hydrogen ions soup opaque gas
a dense cloud which hosts forming stars the lyman alpha photons are trapped in the cloud while the lyc photons are absorbed by the material here the escape fraction is zero
lyman alpha emission line trough at centre with two peaks either side dense cloud
non leakers may have strong emission but also contain dusty opaque material that stopped its clearance from the galaxy
absolute magnitude o hottest b a f g k m coolest l t d white dwarfs s c carbon stars w wr wolf rayet dying supergiants
o type stars 1 in 3,000,000 solar neighbourhood
-10.2 hypergiant 0a 6.6 solar radii > = 30,000 k blue
-09 hypergiant 0b ultraviolet range
-08 hypergiant 0c
-07.5 hypergiant 0d
10 million bubbles in the universe 2021 implies
o type stars 1 in 3,000,000 solar neighbourhood
all created from these galaxies but now o type stars must be 3,000,000 in 3,000,000 at the ionization time
and they escape to make these 10 million bubbles that we now observe 2021
2 million to 10 million years phase ii breakout
lyman alpha emitters 15% of star forming galaxies at z-2
lyman continium leaker phase 50% of lyman alpha emitters
population iii young bright stars parent generation with hydrogen ions weaker soup gas episodes of vigorous star formation hosting super star clusters that carved out holes in the galaxies material clearing paths for ionizing photons to escape and leak out
feedback from these first formed stars gas disperses and creates holes in the cloud allows both lyman alpha and lyc photons to escape this is the lyc leakage phase and the beginning of the lae classification with high escape fractions fesclya 50%
lyman alpha emission line treble peak low low high breakout
crucial copious amounts of photons needed to be emitted at the right time with photon production and escape occurring in sync
-07.5 supergiants ia 1.8 6.6 solar radii 10,000 30,000 k blue white
neutral helium giant molecular clouds
-06 supergiants ib bright giants iib 1.4 1.8 solar radii 7,500 10,000 k white
strong hydrogen line
10 million bubbles in the universe o type stars 1 in 3,000,000 solar neighbourhood
all created from these galaxies but now o type stars must be 2,900,000 in 3,000,000
and supergiants must now be at a ratio of 100,000 to 3,000,000
or
maybe as you state o type stars 1,500,000 of 3,000,000 in 15% of the galaxies
and suprgiants 1,500,000 of 3,000,000 in 15% of the galaxies
10 million bubbles to be created by these o type stars and supergiants plus dark energy and dark matter plus space and time
now i need your dimension of the universe size that these all fit into at the epoch of reionization 350,000 years out as a trade off
and also at z-8 timeline