Authors: Sei Saito, Masaomi Tanaka, Ryo Sawada, Takashi J. Moriya
First Author’s Institution: Astronomical Institute, Tohoku University, Sendai 980-8578, Japan
Status: Accepted to ApJ [open access]
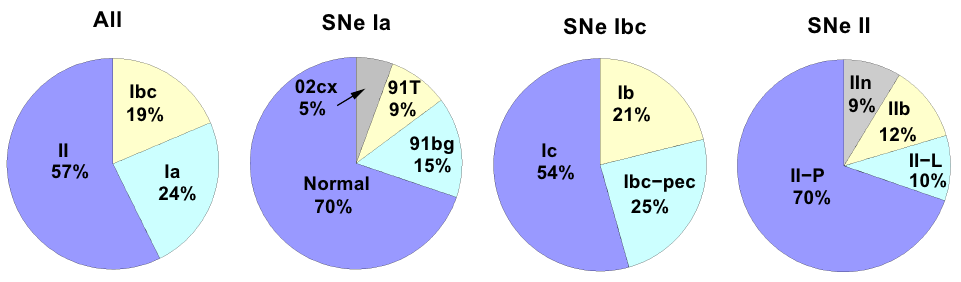
Despite their being some of the most luminous and notable astronomical phenomena – with the first recorded observations dating back thousands of years (e.g. SN 185) – describing successful supernova (SN) explosions is still an open question in astronomy. Broadly, supernovae (SNe) can be classified into Types I and II based on the presence of hydrogen in their spectra. The prevailing explosion mechanism across these two classes (except for Type Ia SNe) is believed to be a process known as core collapse. For stars with masses greater than 6-8 times the mass of the Sun, eventually the stellar core evolves to a point at which nuclear fusion is unable to provide sufficient pressure support to balance the star’s gravitational contraction. At this point, the stellar core collapses until it reaches huge densities – material the mass of the Sun is squished into a region the size of a city – and the contraction is stopped. The outer layers of the star and the core rebound off of the newfound pressure support in the neutron star core and drive an outward propagating shock wave. As this shock passes through the layers of the parent star, disintegrating heavy elements like iron, it loses energy, and astronomers struggle to definitively explain how to maintain a sufficiently energetic shock that is able to propagate to the surface of the star. In other words, in many early models, the shock stalls and fails to reach the stellar surface!
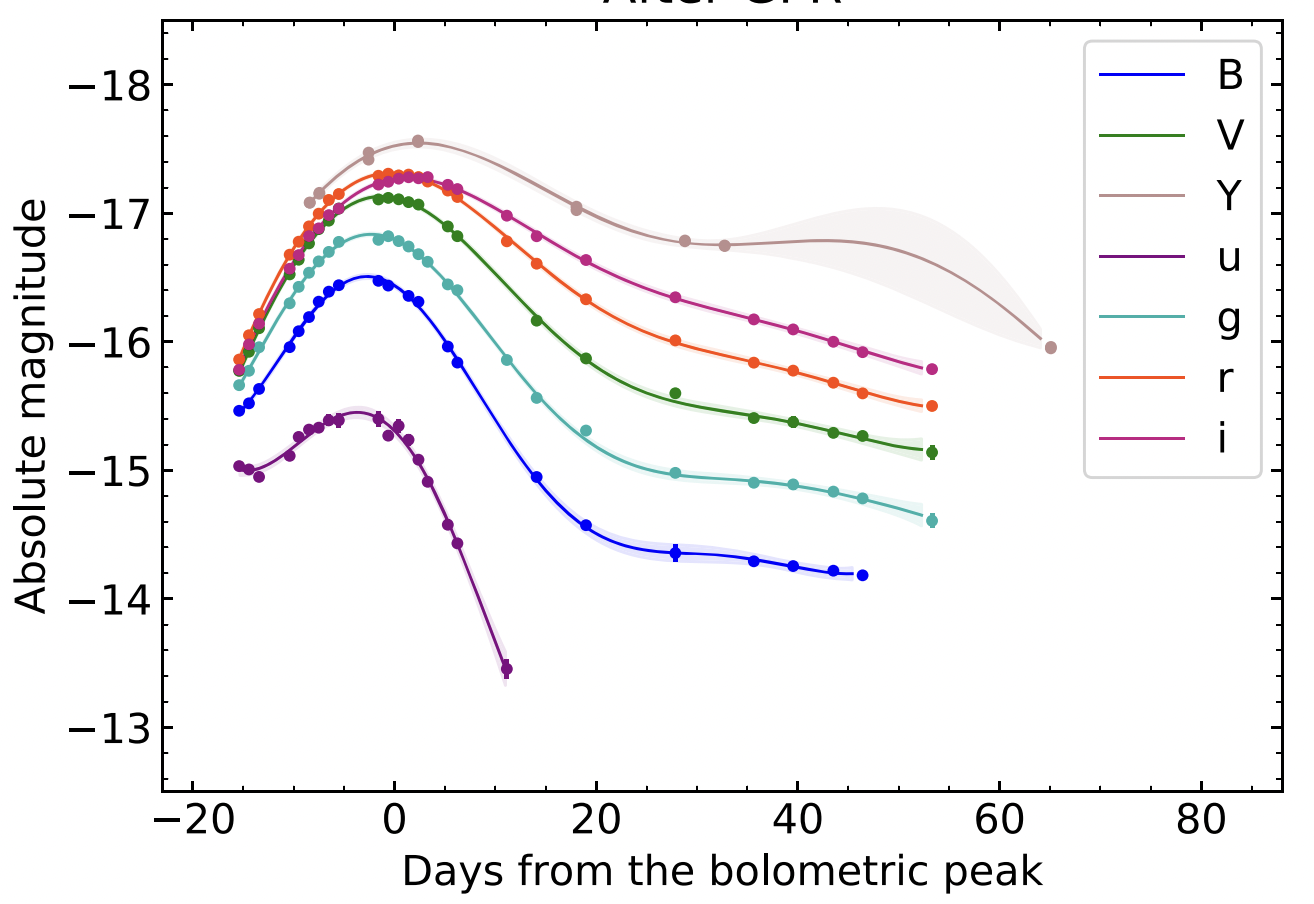
There are a variety of theories that have been proposed to explain this issue, the most popular of these being that absorption of neutrinos behind the shock wave is able to rejuvenate the failing shock. However, because we cannot directly observe the shock propagating through the star, we must instead rely on proxies, such as the light curve produced by the SN, to distinguish between various models. SN light curves, such as those shown in Figure 1, show a sharp brightening and dimming around a characteristic peak luminosity across the spectrum (though the specific features of the curve depend on the SN type). For SNe with minimal hydrogen envelopes – a group known as Stripped Envelope SNe (SESNe) – it is believed that the peak brightness (which is the energy released by the star) is directly connected to the energy released in the radioactive decay of Nickel-56 to Iron-56, so the mass of Nickel-56 in the explosion is crucially related to the observed light curve. Therefore, any good model to describe how to manufacture successful SN explosions needs to also be able to produce the requisite amount of Nickel-56 to explain our observations.
It also turns out that the amount of nickel that is generated in the explosion is inversely related to the explosion timescale and various theoretical models for the explosion produce a variety of predictions for this explosion timescale and thus the nickel mass. Today’s authors seek to contextualize this range of theoretical predictions by placing a bound on the explosion timescale directly from observations of SNe.
Crunching the Numbers
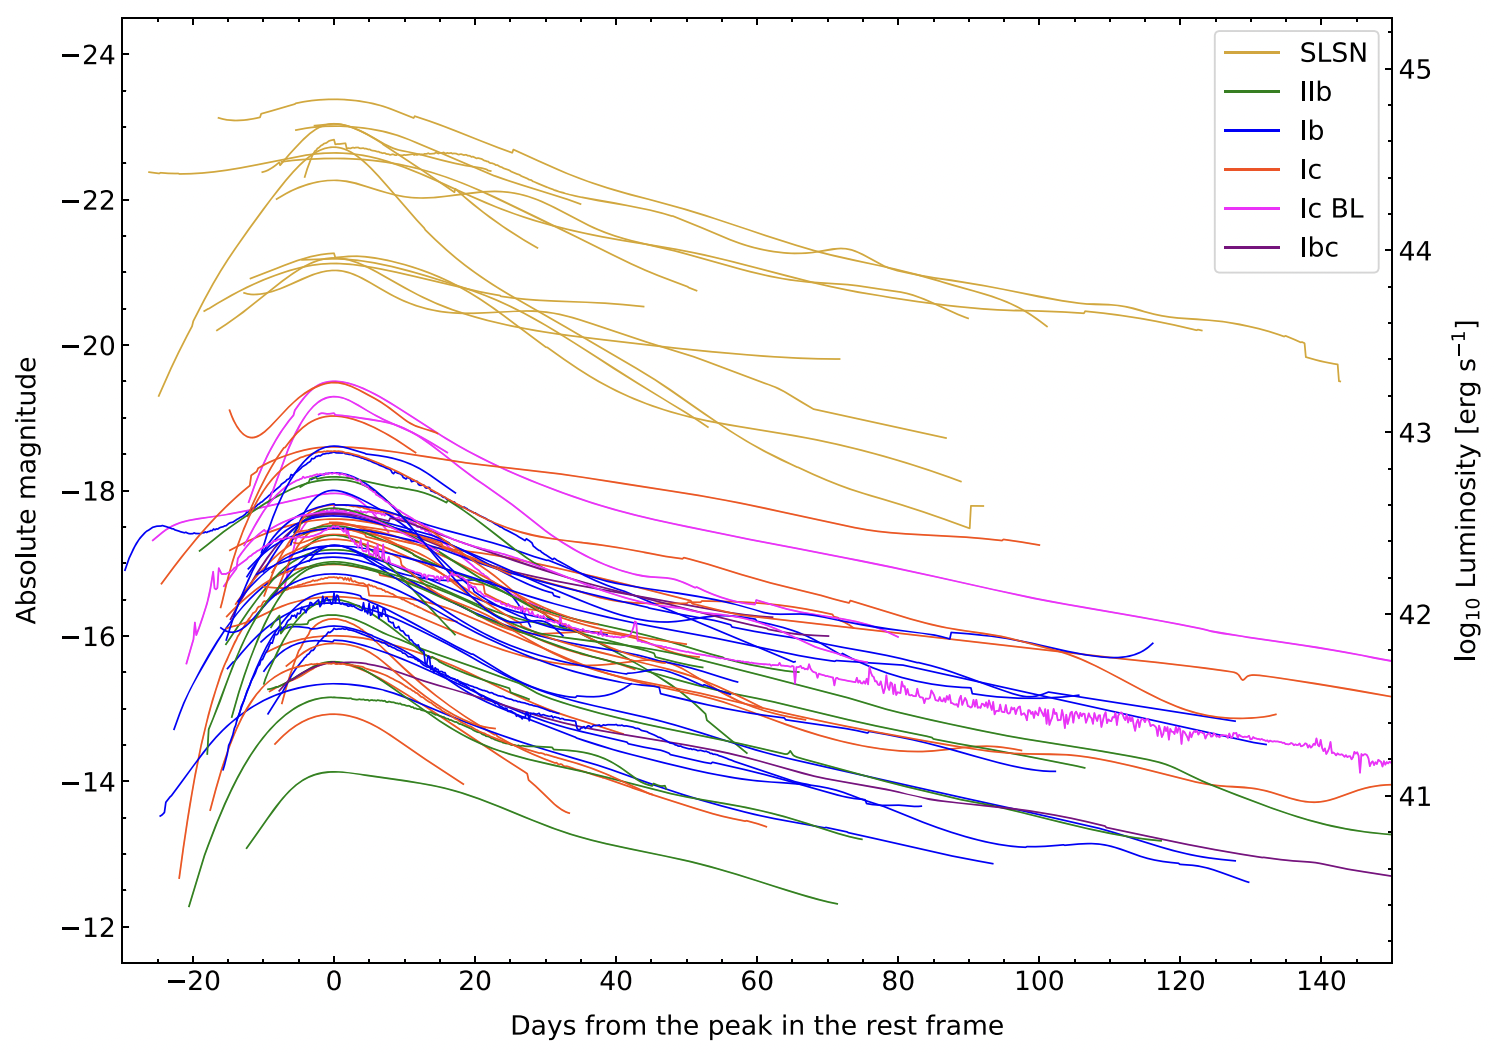
To compile observational data, the authors of today’s paper use photometric data of SNe from the Open Supernova Catalog, which contains over 800 SESNe with data in several filters. Of these, roughly 400 had enough observations in every filter that interpolated light curves, such as the example given in Figure 1, could be constructed. Because the Open Supernova Catalog also provides the luminosity distance (the relationship between the absolute and apparent magnitude) of these sources, the authors are able to fit a blackbody spectrum to the estimated spectral energy distribution across the various photometric bands. This allows them to sum up the flux over the observed wavelength range, ultimately yielding the bolometric (wavelength-summed) light curves for these SNe, that they will later use in conjunction with analytic models to estimate various properties of the explosion. From this, they measure the peak bolometric magnitude, Mpeak, and a characteristic decline timescale that describes the time it takes the luminosity to drop by 0.5 mag from Mpeak. Ultimately, this process, combined with their data cleaning steps, yields 82 bolometric light curves, depicted in Figure 2.
How Do We Use These Measurements?
As we discussed earlier, the key measurement to be made, the nickel mass, is directly connected to the observed light curves and thus to Mpeak. The amount of nickel that can be produced in the supernova explosion also depends on the amount of material available from the start – namely, the properties of the parent star. Therefore, the authors also compute how much material is ejected in the explosion, which can be estimated from the decline timescale measured from the light curve. The decline timescale is set by the velocity of the ejected material, its composition, and its mass, so they can make some reasonable assumptions about the velocity and the composition to estimate the ejecta mass.
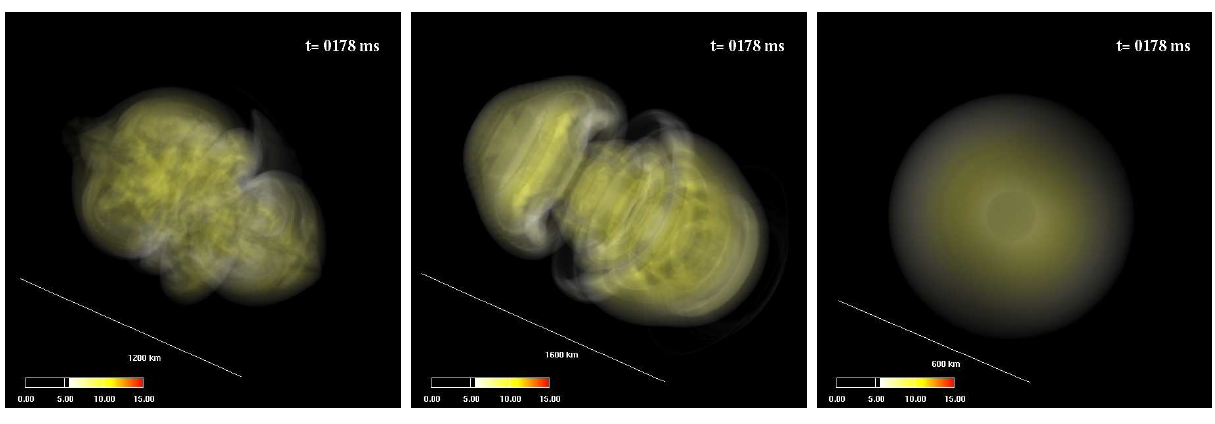
To connect these observations to an estimate of the explosion timescale, the authors run a series of hydrodynamical and nucleosynthesis calculations to generate predictions of the nickel mass and ejecta mass for various explosion timescales. In particular, they model the explosion with a one-dimensional hydrodynamical simulation and use the nucleosynthesis code to track the formation of nickel. These simulations can be described by the mass of ejected material and the explosion timescale, so they compute the nickel mass produced for various reasonable values of the explosion timescale and ejecta masses that span the observed range.

So How Much Time is This Really?
In Figure 3, the authors show the results of the modeled relation between nickel mass and ejecta mass for various explosion timescales (blue curves). Due to the uncertainties in the models, these are upper limits so the models account for the observations (gray points) that fall below the lines. From this, the authors argue that the curves corresponding to 0.1-0.3 second explosion timescales account for a majority of the observed nickel masses, whereas the 1 second timescale bound allows for <50% of the data. This comparison places constraints on future models of core collapse SNe, dictating that observed nickel masses require very rapid timescales for these explosions to occur. Evidently, like Mr. Bond, these massive stars have (almost) no time to die.
Astrobite edited by Sabina Sagynbayeva
Featured image credit: adapted from Yahoo Movies
Sahil: Thanks for the astrobite!
When the authors talk about the “timescale” of the explosion, to what are they referring? I.e., is that the time between when the core starts to collapse and then bounces? In other words, when does the clock start and stop ticking, and what is happening during that time?
That’s a great question (and is probably something I should have mentioned)! The explosion timescale referred to in this paper is the time it takes for the explosion to reach the “standard SN explosion energy”, or 10^51 erg. This is measured from when the core stops its collapse and bounces off of the proto-neutron star, so when the shock wave begins propagating outwards.
Sahil: Thank you for the clear (and prompt!) explanation.
I’ve been involved in public science and astronomy education for about 20 years, while working for 36 years in Electronic Design Automation (i.e., making integrated circuits). Having recently retired, I am finally getting to pursue a Masters in Astronomy to deepen my understanding and further enhance my ability to communicate the subject to the general public. I have found astrobites such as yours very helpful in staying on top of cutting edge research.
Thanks again for the original post and for taking the time to clarify this for me.
Best Regards,
gReG