Paper Title: The isotropic gamma-ray emission above 100GeV: where do very high energy gamma rays come from?
Authors: Raniere de Menezes, Raffaele D’Abrusco, Francesco Massaro, Sara Buson
Corresponding Author Affiliation: Lehrstuhl für Astronomie, Universität Würzburg, Emil-Fischer-Strasse 31, 97074 Würzburg, Germany
Status: Submitted to ApJ [ArXiv open access]
Where do extragalactic very high energy gamma-rays (energies > 100 GeV) come from?
We are constantly being bombarded by photons from all over the electromagnetic spectrum, from all over our galaxy. Many of these have known sources – the sun, for example, which emits primarily in the optical wavelengths. But what about at higher energies? Where are the highest energy gamma-rays we see coming from?
Very High Energy (VHE) gamma rays are challenging to produce – they require some of the most extreme environments and conditions. Studying these VHE gamma-rays can thus tell us about the highest energy processes in our universe, and is a way of probing these extremely high energy sources.
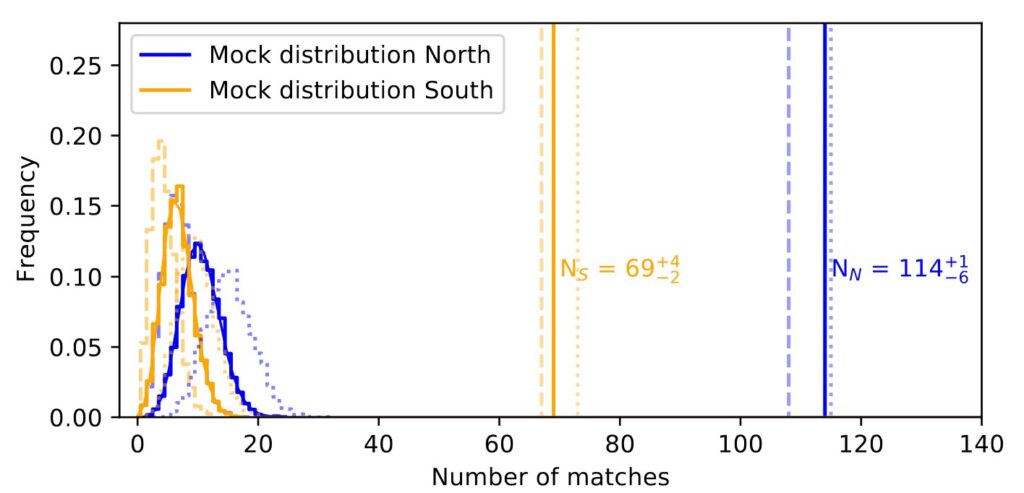
One possible extragalactic source for these VHE gamma-rays are blazars, which are a type of Active Galactic Nuclei (AGN) with a relativistic jet pointing towards the observer (see the types of AGN in Figure 1). These jets can accelerate particles to relativistic energies, which then can produce VHE gamma-rays that we observe.
Today’s paper investigates the source of extragalactic diffuse VHE gamma-rays, by investigating correlations between VHE gamma-rays and blazar catalogs. They aim to test if the isotropic VHE gamma-rays that have been observed could be coming from blazars.
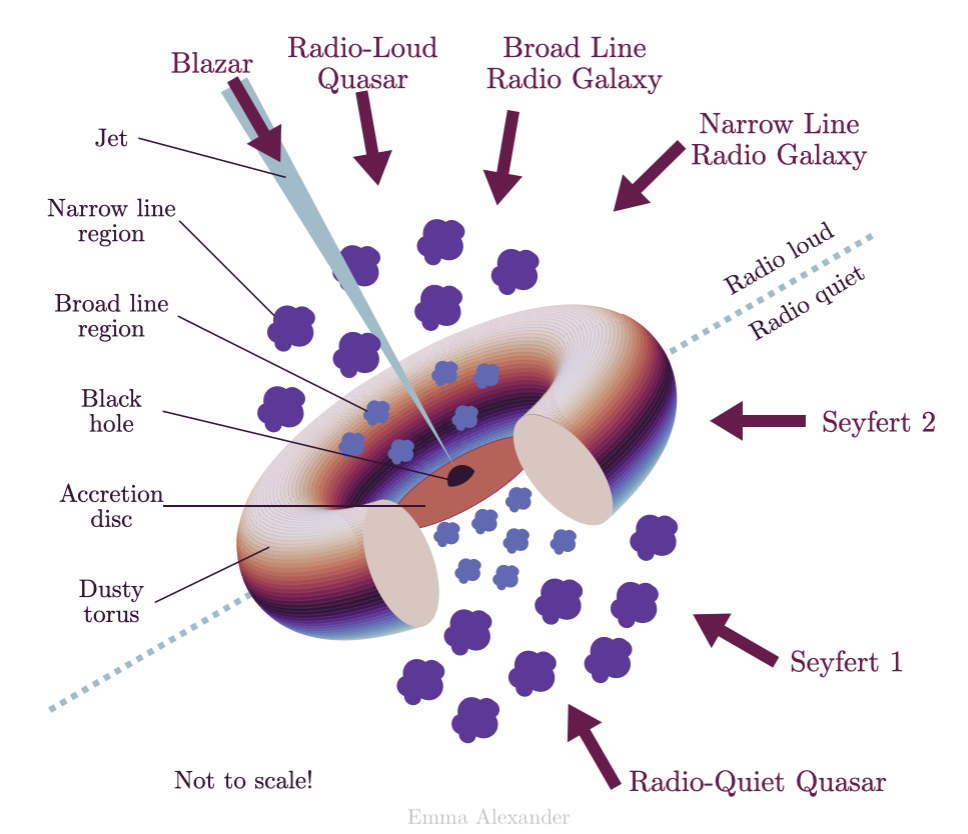
(Image credit: Emma Alexander, https://emmaalexander.github.io/resources.html)
What does the VHE sky look like?
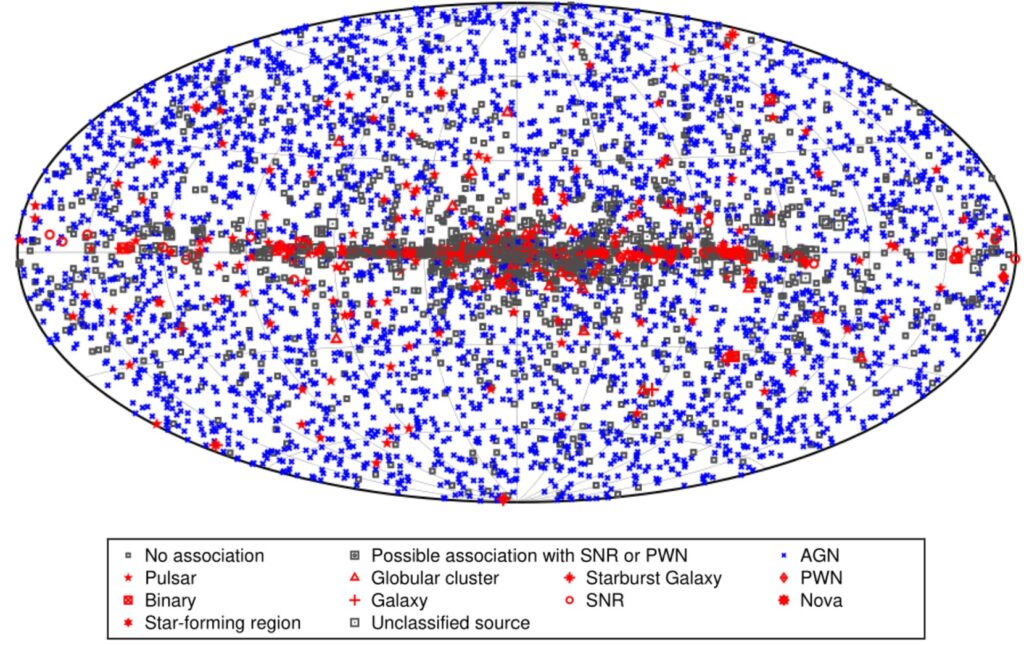
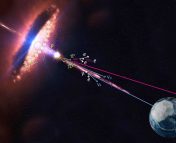
These authors look for VHE gamma-rays from blazars collected by several catalogs, including 4FGL-DR3 from Fermi-LAT called (which can be seen in Figure 2), Roma-BZCat, as well as other catalogs of blazars. The extragalactic sky is dominated by blazars, as can be seen in the blue crosses in Figure 2.
This paper describes its event selection in galactic coordinates, which is done because the sources of VHE gamma rays are different from the Milky Way versus extragalactic sources. To look at extragalactic sources, the authors look at photons and sources that can be seen in galactic latitude (usually called b), b>50 degrees (Northern galactic hemisphere) and b<-50 degrees (Southern galactic hemisphere).
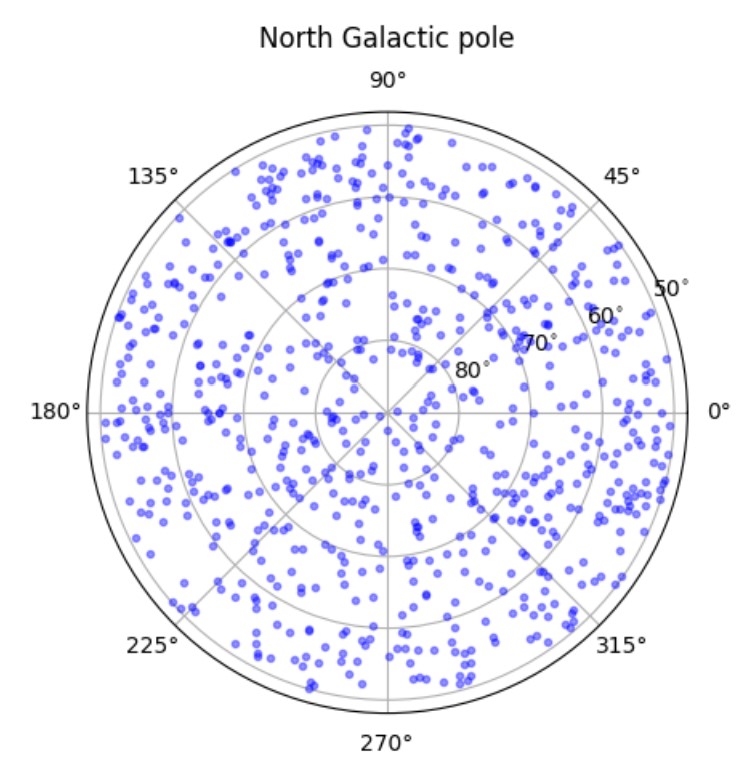
The authors test the hypothesis that a single VHE photon can be attributed to an astrophysical counterpart. To do that, they want to mask out all the clusters of VHE photons coming from bright gamma ray sources, to avoid double counting these clusters with multiple sources. After doing this masking, the data sample being used in both the Northern and Southern galactic regions can be seen in Figure 3.
The results: do VHE photons come from blazars?
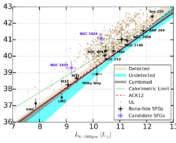
Using these methods, they establish an association radius, rassoc=0.15 degrees, where for each photon, a blazar from the catalogs is associated with that photon if it is within that radius. They then create 5000 mock photon lists, by displacing each data photon by a random amount between 0 to 5 degrees in a random direction. The number of matches in the real data can be compared to each of these mock lists to get a statistical significance for the real data, which can be seen in Figure 4.
They find that 22.8% of the extragalactic VHE photons can be associated with blazars at a significance level of 40.3 sigma combined between the two hemispheres (this is extremely high significance – just 5 sigma means that there is a one in one million chance that it’s a random fluctuation). About 70% of those associations are with a particular type of blazar, BL Lac objects, although BL Lacs are only 28% of the main catalog.
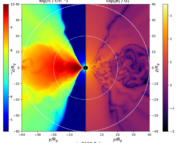
They also consider the completeness of their catalog, and check this result with other catalogs, including one that is more complete. Completeness is a measure of what percentage of sources of a certain type are present in a particular catalog. For example, if we were able to know that there are 1000 blazars in a particular region of the sky covered by a catalog, but only 500 of them are in the catalog, then that catalog is 50% complete. With this more complete catalog (called WISECATS), they find 27.3% of these VHE photons are associated with blazars.
Conclusions: what does this mean?
The authors are able to draw a few different conclusions from this paper. Their main question in this analysis is: Is 1 VHE extragalactic photon detection evidence for a blazar?
The answer seems to be No: they observe 22.8% of the VHE photons in their sample can be associated with blazars, which means that more than 75% of VHE gamma rays have no clear origin. Even when using a catalog with more blazars, they still find less than 30% of the VHE gamma rays can be said to come from blazars. Another interesting result from this paper is that almost 70% of their matches are from BL Lac objects, rather than other types of blazar.
These results are especially exciting for upcoming gamma-ray telescopes, like the Cherenkov Telescope Array (CTA), which will be able to investigate these VHE gamma rays and hopefully give more insight into the extragalactic diffuse gamma-ray sky.
Astrobite edited by Evan Lewis
Featured image credit: edited image, combined treasure map, Fermi-LAT, and NASA

Jessie: Thanks for the astrobite – very interesting.
One question: In Fig 4, do the SOLID lines represent the catalog matches, while the DASHED lines are the mock data?
Thanks for your question! In that figure, the type of line (solid or dashed) is actually showing what value for the association radius was used. The solid lines mean that the calculated association radius was used, both for the mock lists and the actual number of matches. The dashed lines show that the association radius + error (dotted) or association radius – error (dashed) was used. The calculated catalog matches are shown in the lines on the right hand side of the plot, and the mock distributions are shown on the left side of the plot.