Title: Modeling Stellar Surface Features on a Subgiant Star with an M-dwarf Companion
Authors: M. C. Schutte, L. Hebb, S. Lowry, J. Wisniewski, S. L. Hawley, S. Mahadevan, B. M. Morris, P. Robertson, G. Rohn, G. Stefansson
First Author’s Institutions: Homer L. Dodge Department of Physics and Astronomy, University of Oklahoma, Norman, Oklahoma
Status: Published in the Astronomical Journal (open access)
Today’s authors search for polka dots of concentrated magnetic flux on the surface of a subgiant star.
A Menagerie of Astrophysical Phenomena
The surface of a star is a menagerie of astrophysical phenomena: flares that dramatically increase the brightness of the star, coronal mass ejections that spew plasma into space, and cold, dark regions that grow and decay called starspots (check out this astrobite to learn more about stellar activity). Understanding this stellar activity is not only imperative for understanding stellar evolution, but also for studying the planets that orbit these stars.
The Many Uses of a Light Curve
One of the main ways that exoplanet scientists search for planets is with a technique called the transit method. They monitor the brightness of a star, looking for a dip in that brightness. This dip can be caused by a planet passing, or “transiting,” in front of the star as seen from Earth. However, this graph of the brightness of the star — called a light curve — can also be used to detect other celestial happenings. Astronomers have used light curves to study binary star systems, supernovae, and — in the case of today’s authors — starspots!
A Light Curve of Interest
Today’s authors studied the light curve of a star called KOI-340, where KOI stands for Kepler Object of Interest. KOIs are stars that were observed by the Kepler space telescope and are suspected to host exoplanets. This particular KOI is a subgiant star, which means that it is brighter than a normal main-sequence star, but it is not as bright as a giant star. KOI-340 also hosts a smaller, colder M dwarf companion, making it a binary star system.
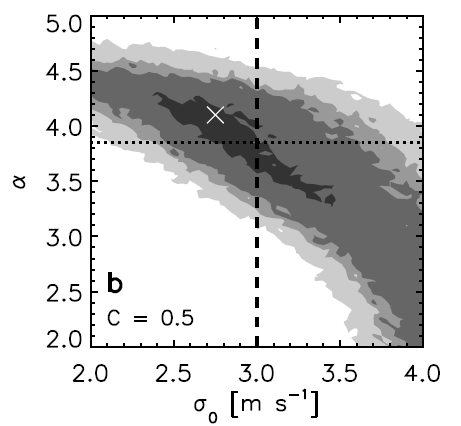
The light curve of KOI-340 was of interest to today’s author because the depth of the planet’s transit is shallower than it should be if the star did not have any starspots. They therefore used a modeling code called STarSPot (STSP), which is publicly available on github, to model 36 transits of the planet orbiting KOI-340 to show evidence of starspots on the surface of the star. They found that the average size of the starspots is roughly 10% the size of the star, which would make these starspots some of the largest ever recorded (Figure 1).
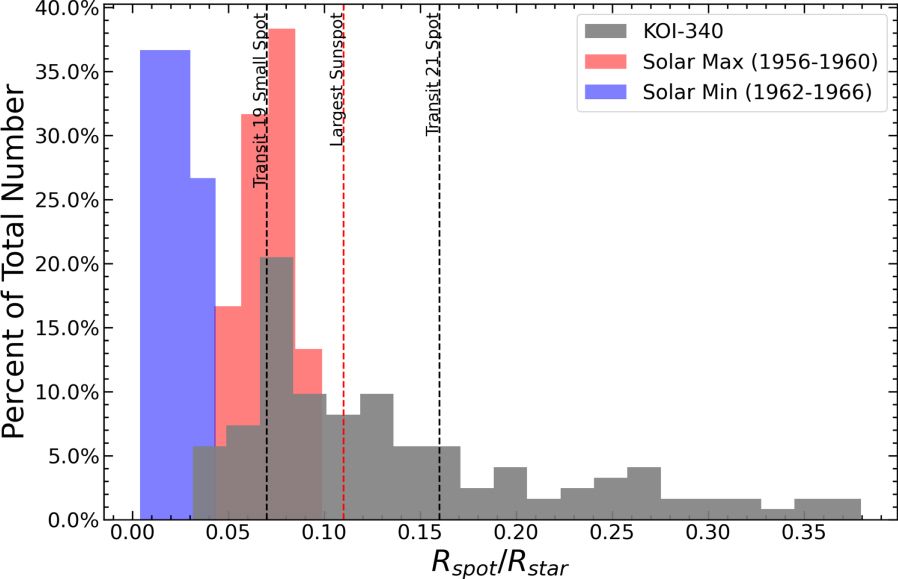
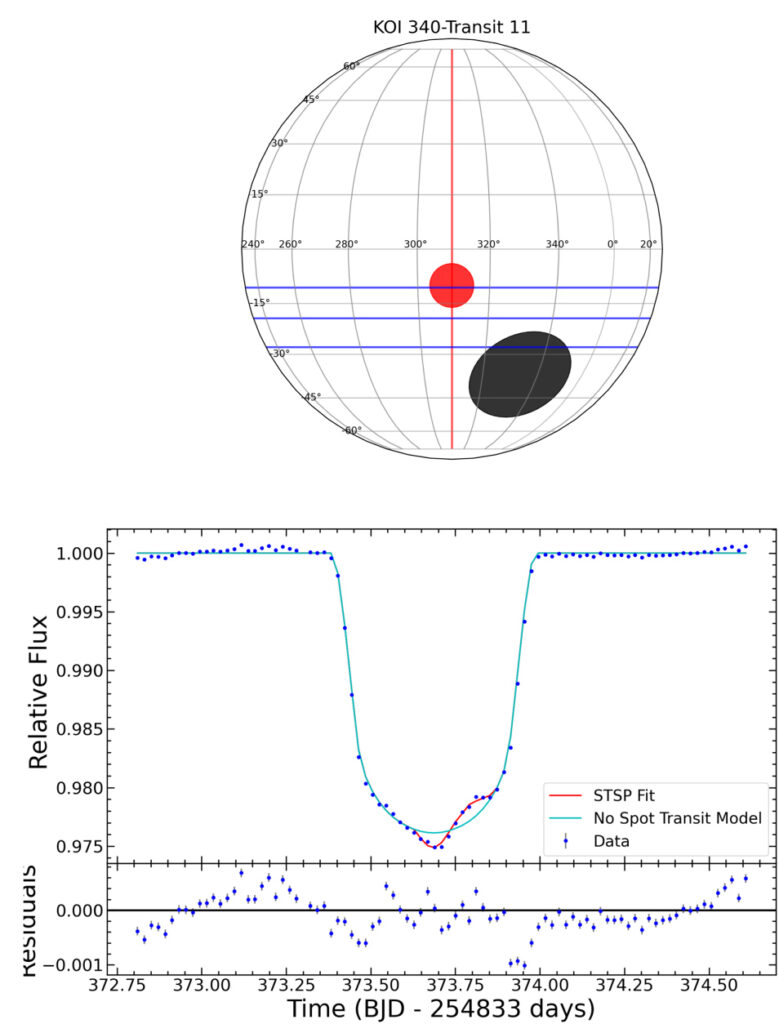
The authors even found a starspot as large as 16% the size of the star (Figure 2)!
In a different transit, the authors found an additional dip in their fit, indicating the presence of a bright spot on KOI-340 followed by a dark spot (Figure 3).
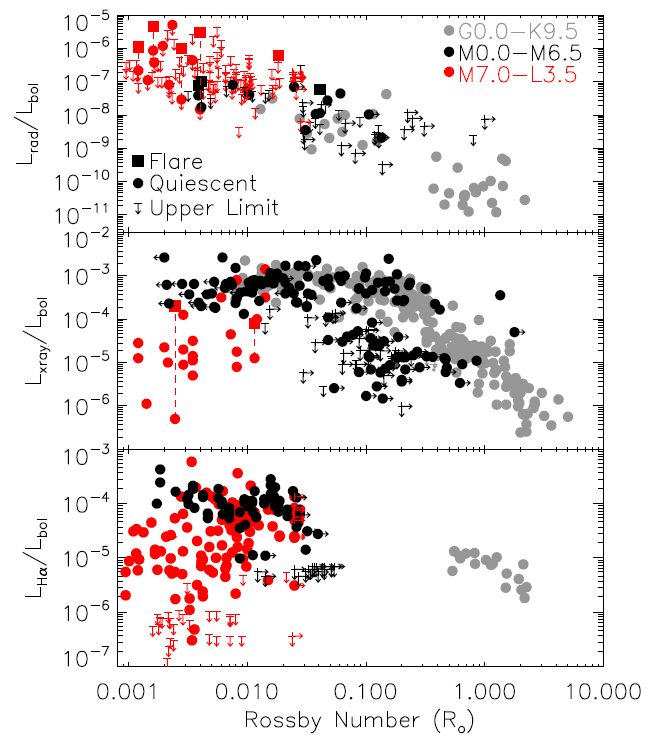
This work shows that starspots are simply a nuisance to exoplanet scientists; they are also a window into the life and evolution of the star itself. For example, the authors of today’s paper were able to conclude that the increased activity on KOI-340 as compared to the Sun is likely due to its faster rotation and/or its increasing convection zone size as it evolves from a main-sequence star into a red giant star.
In general, today’s authors show us how multifaceted starspots can be, as well as the splendor of polka-dotted stars!
Astrobite edited by Maryum Sayeed
Featured image credit: NASA/SDO
Starspots are colder than the regular stellar surface, so why do they show up as bumps in the light curve, rather than as dips?
Great question! When a planet passes in front of a starspot as it moves across the disk of its host star, the relative flux received from the system increases, creating a “bump” in the light curve. Essentially, the planet is “removing” less light when it transits in front of a starspot compared to when it transits in front of the non-spotted stellar surface.
So, if I understand you correctly: the total flux received from the star during the planetary transit is lowered by the existence of the starspot; when the planet passes in front of the non-spotted surface, the flux received is still lowered because we’re still seeing the starspot; when the planet passes in front of the starspot, we see the star’s light without averaging in the starspot’s lower flux. If the starspot didn’t exist, the light curve would show the planet’s dip lined up with the top of the “bump,” rather than the dip where it is without the “bump.”