Authors: B. E. Miles, B. A. Biller, P. Patapis, et al.
First author’s institution: University of California, Santa Cruz, and University of California, Irvine
Status: Open access
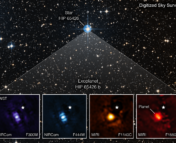
In yesterday’s bite, we took a look at JWST’s first direct image of an exoplanet, and in today’s course, we serve up JWST’s first direct spectrum of a planetary-mass object! In addition to exoplanet detection, the Direct Imaging Early Release Science (ERS) team also proposed to conduct direct spectroscopy of widely-separated planetary-mass objects. Ground-based observing has several major complications, such as absorption from gases in the Earth’s atmosphere and strong thermal background emission from Earth as well as telescopes themselves. To avoid this, space-based direct spectroscopy with actively cooled instruments (JWST gets down to 7 degrees above absolute zero!) is the best way to characterize the atmospheres of widely-separated, resolved planetary-mass objects. In addition, JWST’s broad spectral sensitivity (from 0.6-28.1 microns), allows astronomers to observe nearly all of the energy emitted by planetary-mass objects across a wide range of temperatures, from 300-1000K. Although today’s target isn’t exactly an exoplanet (rather a brown dwarf), these observations could easily be extended to exoplanets.
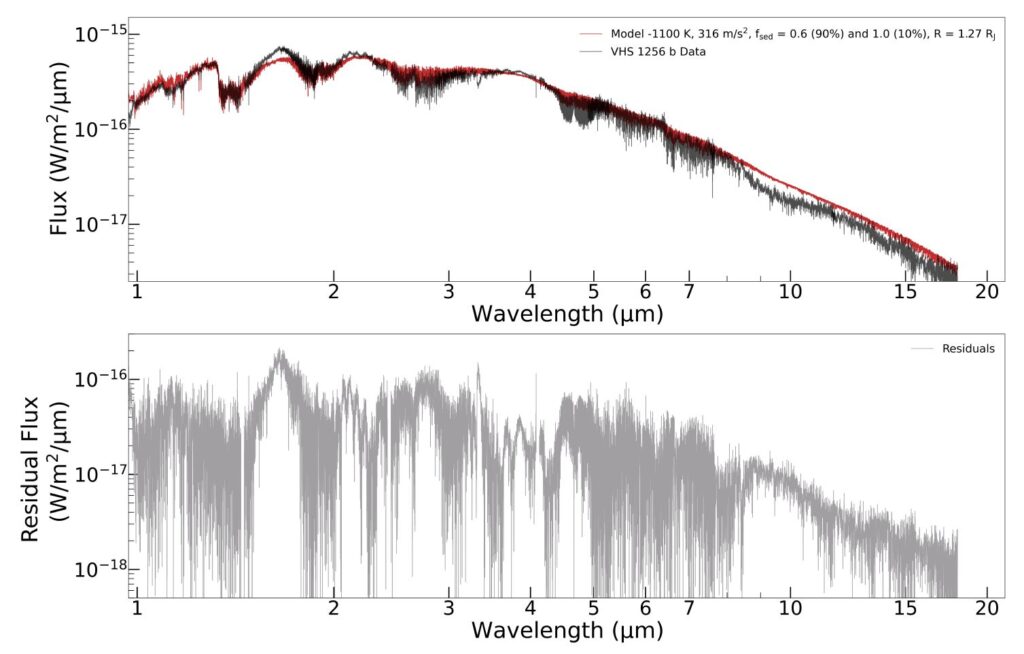
Here, the authors present the first direct spectrum of a planetary-mass object from JWST, showing the emission spectrum of substellar-companion VHS 1256 b from ~1-28 micron. VHS 1256 b is a young (<300 Myr), nearby (22pc), widely-separated (150 AU) planetary-mass (<20 MJ) brown dwarf straddling the L and T spectral types, known from archival ground and space based observations. The ERS team chose VHS 1256 b for as their spectroscopy target for several reasons. As VHS 1256 b is widely separated from its host binary, it can be observed without contamination from the host. Previous observations have confirmed its similarity to other hot, young planets (namely the well-studied HR 8799 system) and have shown hints of interesting atmospheric chemistry. Also, for a hot, young brown dwarf, VHS 1256 b is also extremely variable, the cause of which may be potentially-observable turbulent clouds in its upper atmosphere.
Observing Techniques
The main goal of ERS programs is to demonstrate the technical ability of JWST to conduct science observations ahead of the main group of general observer programs. The observations from yesterday proved the observatory’s sensitivity with its coronagraphs, but direct spectroscopy is a very different beast to tame. Traditional spectrographs pass the light from a particular target through a spectroscopic slit, resulting in a one-dimensional spectrum of the target. Integral field units (IFUs), such as the ones on NIRSpec and MIRI used for this study, produce 3-dimensional “data cubes” made up of dozens or hundreds of individual spectra, effectively taking 2D images at all wavelengths within a certain range.
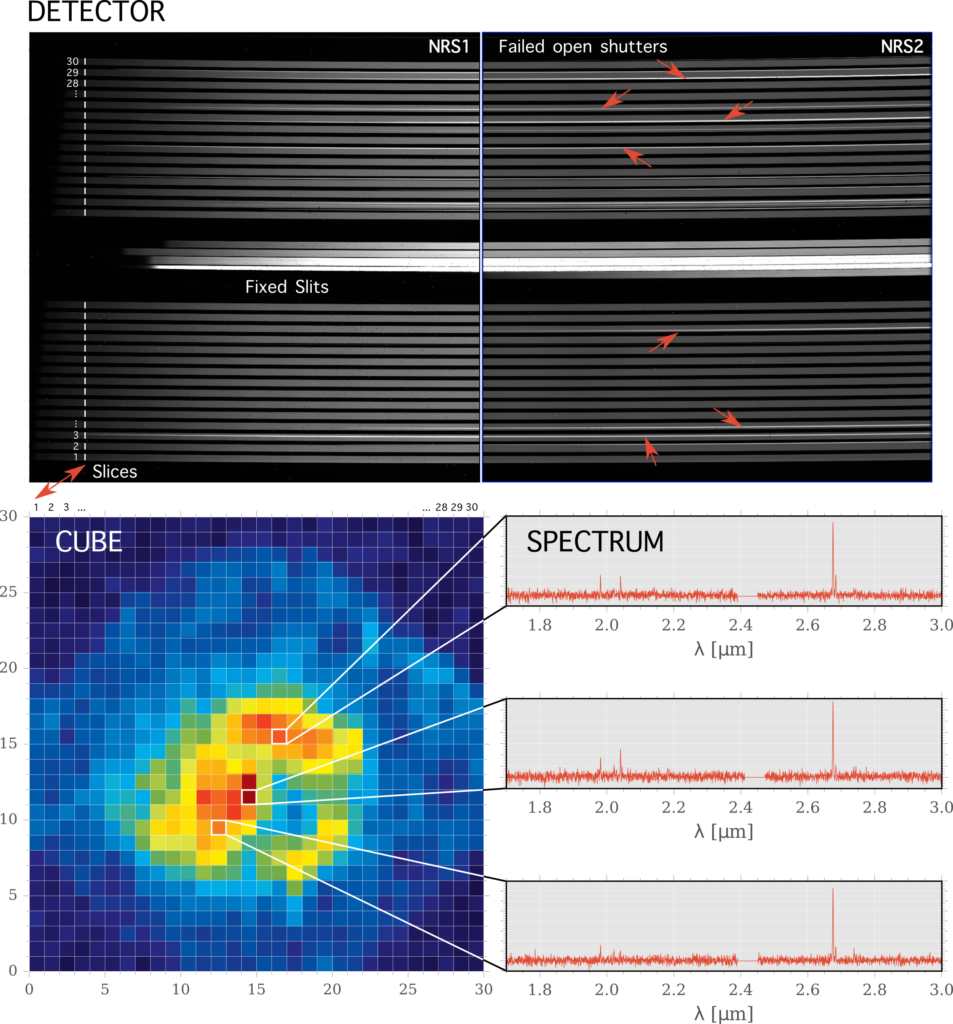
Spectroscopic reduction for IFU instruments takes some care, since in order to obtain the highest quality data the observatory must be dithered (moved slightly in the spatial plane to mitigate cosmic rays, bad pixels in the detector, or undersampling of the image pixels). These dithered data cubes need to be calibrated and reduced as you would any other observation, and only then merged to obtain the final science quality data cube. If these calibration and reduction steps are not performed correctly, the final extracted spectra may not be consistent, especially when trying to analyze several instruments together.
The Broadest Spectrum I’ve Ever Seen
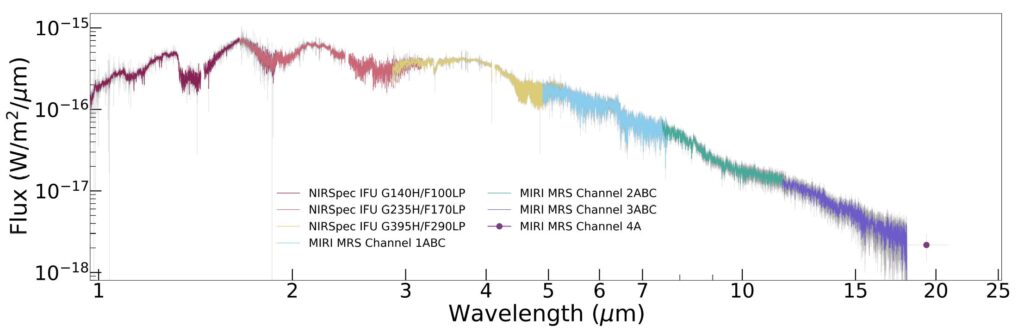
A huge benefit to using NIRSpec and MIRI’s IFU spectroscopy modes for this study is that they have a spectral resolving power of up to R~3000, meaning that at a particular wavelength, the instruments could resolve the difference between spectral lines separated by 1/3000th of that wavelength. Both instruments together span over an order of magnitude in wavelength, nominally from 1 to 28 micron, and combined give one of the most precise and broadest brown dwarf spectra yet observed. Despite the nominal spectral range, the team found that MIRI’s longest wavelength channel isn’t sensitive enough to reliably extract spectra. In order to recover some of the flux from the planet, they elected to add up all the flux in the channel to get a single measurement for that bin. As we’ll see, making this approximation doesn’t hurt the results at all.
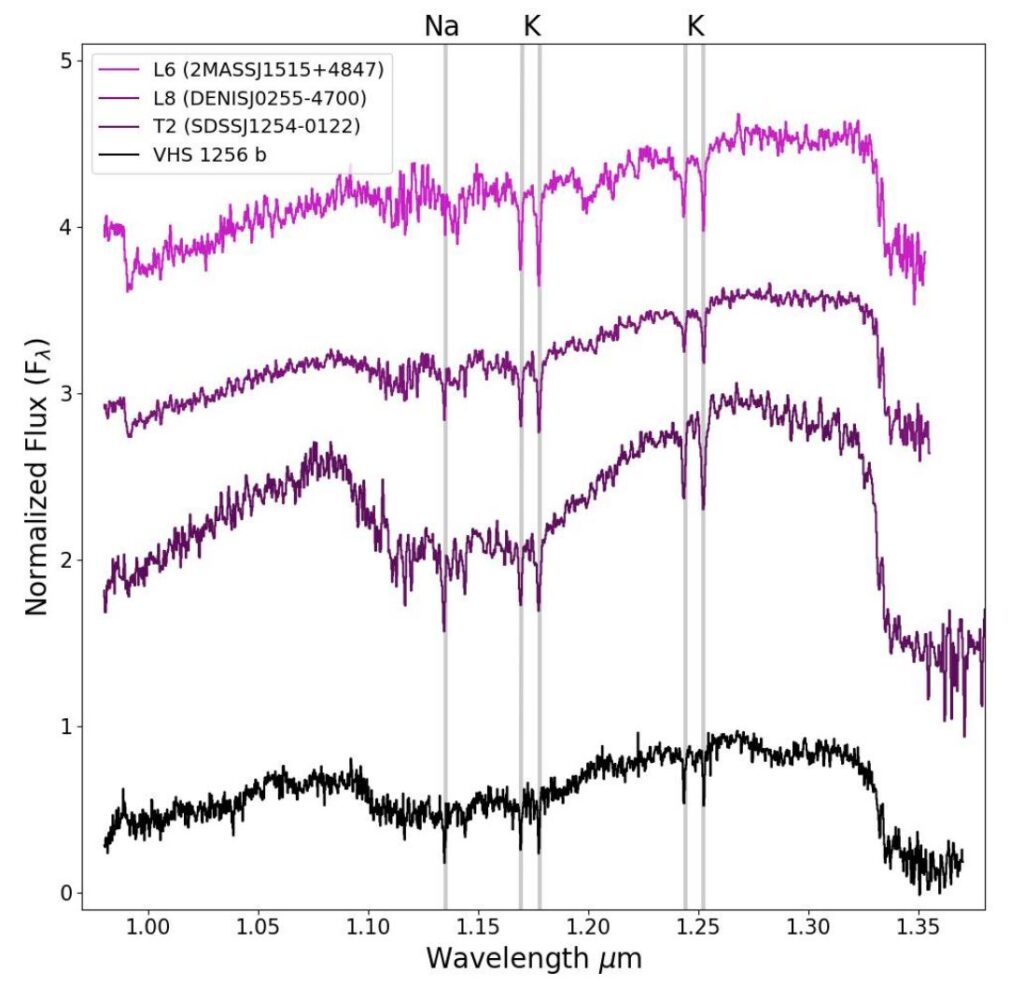
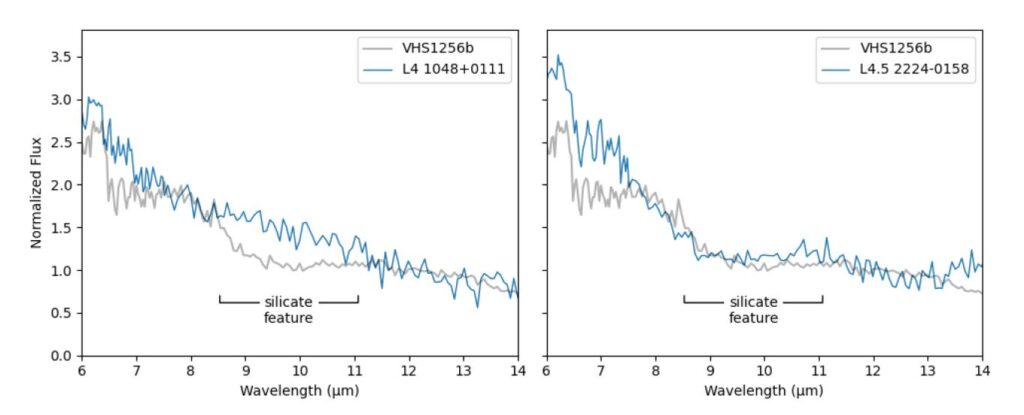
So, what did the team find in VHS 1256 b’s atmosphere? Narrow sodium and potassium lines indicate VHS 1256 b has low surface gravity and confirm its youth. Other alkali metal lines weren’t seen, but could be visible in future reductions. Water vapor, everyone’s favorite IR absorber, is easily seen as a large absorption feature around 1.4 micron, but is also present across the spectrum even out to 10 micron. Cooler brown dwarfs (T class) are expected to show signs of methane absorption near 1.6 micron, and VHS 1256 b has this shallow methane feature as well as another stronger methane feature around 3.3 micron, similar to L class brown dwarfs. The methane features seem to be shallower than expected compared to other similar objects, probably due to disequilibrium chemistry depleting methane in the brown dwarf’s upper atmosphere. Carbon monoxide is common in hotter brown dwarfs and is part of chemical reactions with methane that normally favor one or the other species depending on the brown dwarf’s temperature. VHS 1256 b shows carbon monoxide near 2.4 micron and broadly at 4.6 micron, leading to one of the best-resolved carbon monoxide features among space-based brown dwarf spectra. Carbon dioxide at 4.2 micron cannot be observed from the ground, but is present in the JWST spectrum as slight excess absorption. Clouds, especially those made of aerosolized silicate minerals (SAND CLOUDS!), are common in brown dwarf atmospheres, and VHS 1256 b is no exception. While clouds ordinarily condense down into the lower, invisible regions of a brown dwarf’s atmosphere without sufficient heat, low surface gravity can keep them aloft even at cooler temperatures. By comparing VHS 1256 b’s spectrum to other known cloudy and clear brown dwarfs, the team was able to identify evidence for silicate clouds on VHS 1256 b.
Modeling and Atmospheric Implications
The ERS programs are intended to have quick turnarounds, so the authors don’t fully analyze VHS 1256 b’s spectrum. Instead, they used assumptions on the amount of atmospheric mixing as well as a range of temperatures to compute several model atmospheres and compare them to the observed spectrum. They used the PICASO code, a self-consistent atmospheric modeling code including disequilibrium chemistry, clouds, and pressure dependent atmospheric mixing, in order to create their model atmospheres. Incorporating these factors is important, as the increased CO and decreased CH4 absorption indicates the presence of chemical disequilibrium due to atmospheric mixing. They were not able to fully fit the silicate cloud features, but future work should be able to precisely measure the abundances of the observed atmospheric species.
Another major result of the broad spectrum is the ability to precisely measure VHS 1256 b’s luminosity. With a known distance to the system, and some reasonable age and mass estimates, you can guess at how luminous a particular object is. The team sampled around VHS 1256 b’s best age estimate and also sampled across a wide range of masses. They then took those parameters and calculated a whole host of assumed luminosities given the assumed masses and ages. By comparing their calculations to a grid of model luminosities, the team confirmed that VHS 1256 b is less than 20 Jupiter masses. However, they were not able to determine whether it lies above or below the deuterium burning limit (~13 Jupiter masses), a fuzzy boundary separating planets from brown dwarfs.
Next Steps
These observations are only the first glimpse of what JWST will bring to brown dwarf atmospheric characterization. As these operations mature, and more brown dwarf atmospheres are observed, we’ll continue to gain a deeper understanding of brown dwarfs and the hot, young exoplanets they’re so similar to.
Astrobite edited by: Briley Lewis
Featured image credit: NASA/ESA/CSA, B. E. Miles, and the JWST ERS-1386 Team
Are ordinary people already able to download data from JWST?
Yes! Public data from JWST (as well as Hubble, TESS, and other US space observatories) is available for download at: https://mast.stsci.edu