Title: A microlensing measurement of dark matter fractions in three lensing galaxies
Authors: N. F. Bate, D. J. E. Floyd, R. L. Webster, J. S. B. Wyithe
Institution: University of Melbourne, Victoria, Australia
I’ve written a fair amount about strong gravitational lensing and today I’m going to go far a-field and talk about… microlensing. In my previous posts, I have talked about one application of strong lensing: the detailed study of distant lensed galaxies. But, it can also be used to measure the total amount of mass in the foreground galaxy, thus allowing us to determine the ratio of dark matter to luminous matter (which can be calculated from how much light you receive from the galaxy). Constraining the amount of dark matter in galaxies is the goal of this paper, but the authors make use of microlensing instead of strong lensing.
The quasars in this work are actually also strongly lensed, and thus are multiply imaged. If strong lensing were the only effect, we would expect all the multiple images to have the same flux. But in fact, some lenses exhibit what are known as “anomalous flux ratios”: the multiple images aren’t equally magnified. The figure below is an example of this, taken from APOD. One possible explanation for this is microlensing, which is the result of smaller-scale gravitational influences. The light that creates each image has come to our eye via separate paths through the lensing galaxy, for example passing near different stars. Previous work has shown that microlensing solely by stars is unable to entirely explain the flux anomalies, but that adding a dark matter component can account for the remaining differences.
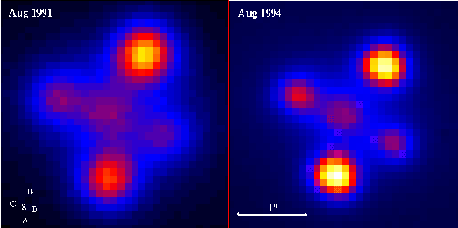
Astronomy Picture of the Day, July 11 1995: A picture of the strongly-lensed quasar called the "Einstein Cross." The four images are the result of strong lensing (the fifth in the center is actually the foreground galaxy) while the differences in brightness between opposite pairs of images is the effect of microlensing.
The authors look at three lensed quasars in multiple filters (i.e. at different wavelengths) at three different times (or “epochs”). They then simulate microlensing by sending light rays through various lens models which include both clumpy matter (stars) and smoothly distributed matter (dark matter). A standard mass distribution is assumed for the stars, but the amount of dark matter is allowed to vary. For each model, the flux ratio between two of the lensed images in calculated and compared to the true flux anomaly. This allows them to explore the possible parameter space.
The results for the best-fit dark matter fraction in each of the three objects are quite different:
- MG 0414+0534: 50% +30,-40 (not well constrained)
- SDSS J0924+021: 80% +10,-10 (in agreement with previous estimates)
- Q2237+0305: < 50% (an upper limit, but a low dark matter fraction is expected because the region probed is the inner part of the galaxy, where stars should dominate.)
First of all, the errors — quoted at 68% confidence — are quite large, especially for #1 and for #3. This is because the dark matter is only varied in increments of 10%, which is rather coarse sampling; thus the authors caution that these results should only be considered estimates. However, they are still quite interesting!

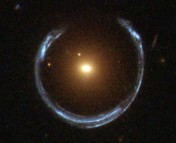
Neat post! Interesting bit of trivia, the Einstein Cross was actually discovered by John Huchra, and the galaxy is named Huchra’s Lens: http://www.noao.edu/image_gallery/html/im0553.html