- Paper title: The Lyman-alpha forest in three dimensions: measurements of large scale flux correlations from BOSS 1st-year data
- Authors: Anže Slosar, Andreu Font-Ribera, Matthew M. Pieri, James Rich, Jean-Marc Le Goff, Éric Aubourg, Jon Brinkmann, Nicolas Busca, Bill Carithers, Romain Charlassier, Marina Cortês, Rupert Croft, Kyle S. Dawson, Daniel Eisenstein, Jean-Christophe Hamilton, Shirley Ho, Khee-Gan Lee, Robert Lupton, Patrick McDonald, Bumbarija Medolin, Jordi Miralda-Escudé, Adam D. Myers, Robert C. Nichol, Nathalie Palanque-Delabrouille, Isabelle Pâris, Patrick Petitjean, Yodovina Piškur, Emmanuel Rollinde, Nicholas P. Ross, David J. Schlegel, Donald P. Schneider, Erin Sheldon, Benjamin A. Weaver, David H. Weinberg, Christophe Yeche, Donald G. York
- Authors’ affiliation: The SDSS BOSS survey
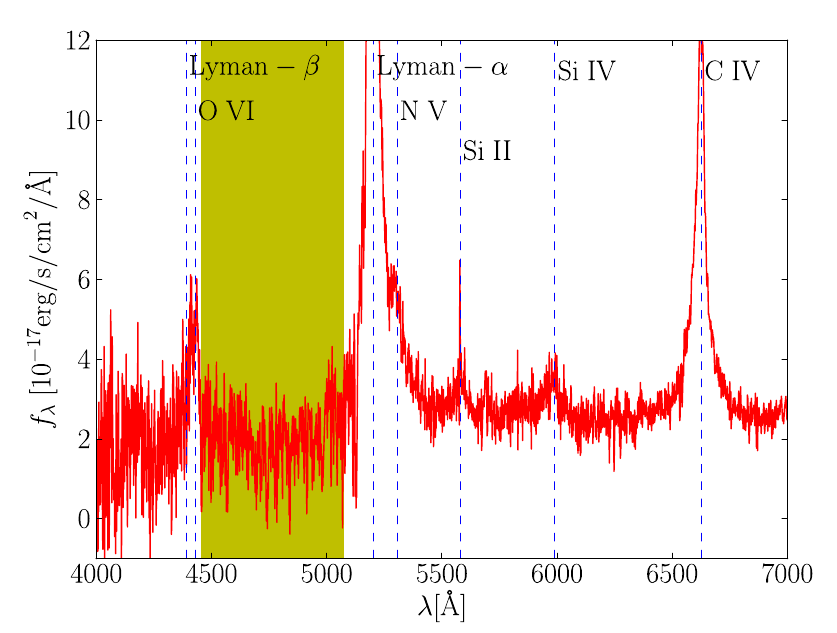
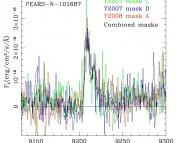
A typical high-redshift (z~3.3) quasar from BOSS, displaying prominent Lyman-α emission and a forest of Lyman-α absorption lines in the shaded region. From Figure 4 of Slosar et al. 2011.
The Lyman-α spectral line has become one of the most important observational tools in astrophysics. Lyman-α absorption occurs when the electron in a neutral (unionized) hydrogen atom is excited from the ground state to the first excited state. Amazingly, when we look at very distant objects such as high-redshift quasars, we see a ‘forest’ of Lyman-α absorption that is caused by all the neutral hydrogen at different redshifts in the intergalactic medium between us, in the modern universe, and our distant source, in the very early universe. Dan had a great explanation of the Lyman-α forest in a previous Astrobite, and our classmates Ragnhild Lunnan and Aaron Meisner have a great writeup of the original paper by Gunn & Peterson in 1965 that first identified this effect and speculated on its cosmological significance.
Observations of the Lyman-α forest in distant quasars has demonstrated to us that at some point after the Big Bang, the hydrogen in the universe transitioned from being neutral to ionized. In other words, there existed a phase change during the epoch of reionization.
One of the most interesting features of this “forest” of Lyman-α absorption lines, that it makes it very powerful for constraining models of cosmology, is its power spectrum or angular correlation scale. This spectrum tells us how common it was for neutral hydrogen clouds were in the early universe to be separated by a given distance. This spatial distribution is related to the clumping of dark matter in the early universe, but it gets distorted by the peculiar velocities of distant galaxies (movements not due to the Hubble flow of cosmological expansion). In the linear model the authors apply for the redshift-space power spectrum, , this distortion is the result of gravitational instabilities operating on the primordial gas overdensities that resulted from inflation.
This distortion as a function of the real-space power spectrum (not biased by peculiar velocities) , wavevector (
) and the cosine of the angle between the wavevector and the line of sight (
) looks like:
where the important quantities to measure are b, the “bias factor” which scales the power spectrum, and β, which controls the directional () dependence. An additional parameter α accounts for the evolution of this distortion with redshift.
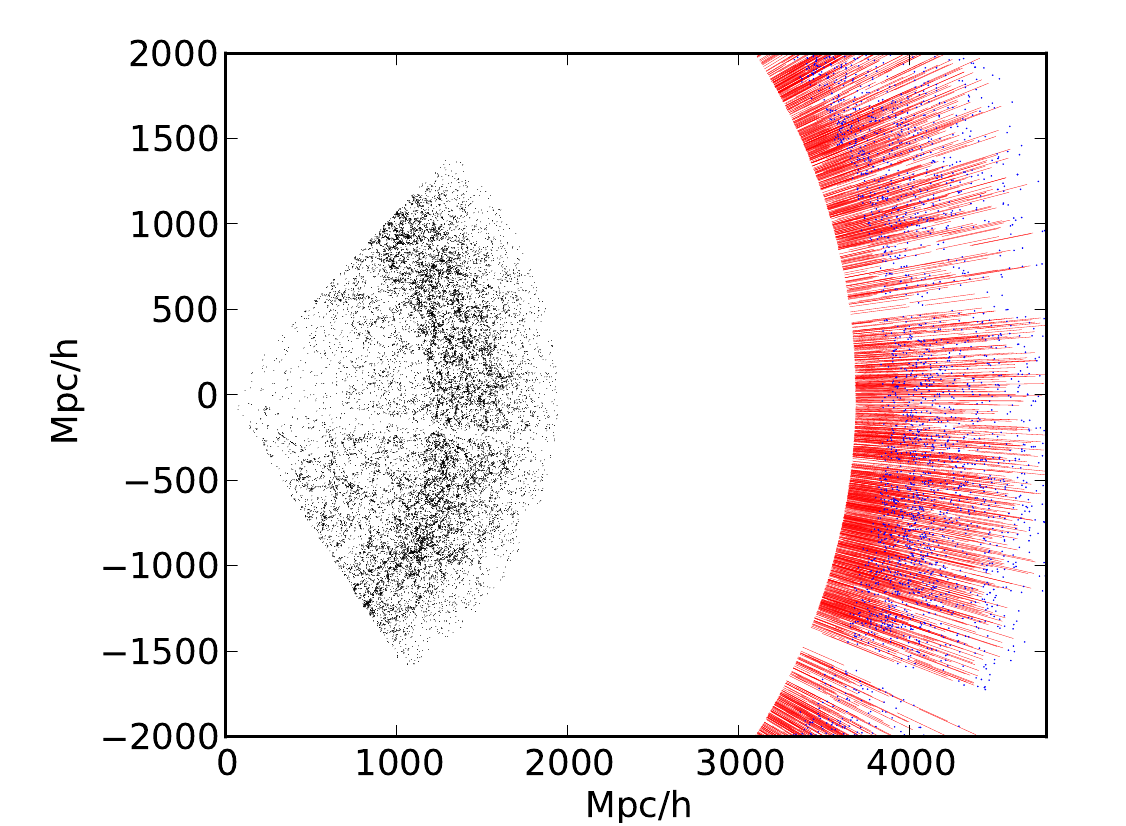
A slice (2D map) of the BOSS survey, illustrating its geometry. The BOSS low-redshift galaxies are plotted in black and the high-redshift quasars are in blue. The red lines illustrate the third dimension of the survey - Lyman-α absorption line spectra along the line of sight to each quasar. From Figure 2 of Slosar et al. 2011
The BOSS survey is a project of the Sloan Digital Sky Survey to take spectra of an incredible number of distant galaxies over 10,000 square degrees (~1/13 the sky). They will take spectra of one and a half million galaxies out to z=0.7 (about 7 Gyr after the Big Bang) in order to precisely determine their redshifts. Additionally, they will take spectra of ~150,000 more distant (2.2 < z < 3, about 2-3 Gyr after the Big Bang) quasars to study the power spectrum of the Lyman-α forest. The instrument they are using, the BOSS optical fiber-fed spectrographs, can take spectra of 1,000 objects simultaneously.
BOSS is unique in that it produces high-quality spectra of so many distant quasars over such a large area of the 2D sky. By analyzing the Lyman-α absorption each spectrum as a function of wavelength (redshift) in each spectrum, they can estimate the neutral hydrogen density as a function of distance along that line of sight. They are thereby creating an unprecedented 3D map of neutral hydrogen in the early universe.
This latest paper is a “proof-of-concept” of BOSS’s ongoing Lyman-α forest survey based on its first 6 months of observations, including just 14,000 of their eventual 150,000 quasars. They construct a model of quasar continuum emission so that they can measure the absorption at a given wavelength in their spectra and demonstrate that the continuum is essentially universal (the same for all quasars). In order to accurately model the limitations of their current dataset, the authors perform simulations where they and add noise to the quasar’s background continuum emission and the Lyman-α absorbers in different ways.
The authors’ main conclusions is that their observations are in good agreement with the standard cosmological model (ΛCDM). Furthermore, the multipoles of the 3D correlation function of the Lyman-α forest measurements are in good agreement with theory, suggesting that the variations in peculiar velocity really could result from gravitational instabilities.
The authors conclude by reminding us that the full BOSS sample, which will include about 10x as much data, will be much more powerful for constraining the cosmological models.

Trackbacks/Pingbacks