Authors: Ian Dobbs-Dixon and Nicolas B. Cowan
First Author’s Institution: Department of Physics, NYU Abu Dhabi
Status: Published in APJL [open access]
The phase curves of transit planets reveal the longitudinal (from day to night) variation. When observing with multiple-wavelengths, they further tell us the information in the radial direction. Different wavebands in principle probe different pressure depths in the atmosphere, since different wavelengths have different opacities (the ability to absorb and scatter photons). However, the opacity is determined by the local temperature, pressure, and gaseous composition, and there is no reason for the opacity to hold constant across the planet, as we will see later. In today’s paper, the authors address this important yet challenging issue when it comes to interpreting the multi-band phase curves.
Trends do not fit with one-dimensional models
When considering a one-dimensional atmosphere, as has been widely used in modeling, we can predict which wavelength will probe deeper into the atmosphere by examining their opacities. Water is one of the main infrared absorbers. Since water absorbs more radiation at 4.5 μm, the opacity at 4.5 μm should be larger than that at 3.6 μm. A larger mass of overlying gas at 3.6 μm is required to achieve the same absorption as at 4.6 μm. Hence, the photosphere (where photons are mostly absorbed and emitted) is deeper at 3.6 μm than at 4.6μm. The radiative cooling operates less efficiently as the pressure increases, hence we know that the day-night temperature contrast should be smaller in the deeper atmospheres. Therefore, one would expect the day-night temperature contrast, represented by the observed phase amplitude, to be also smaller at 3.6 μm than at 4.5 μm. In addition, the phase offset (how the hot spot being shifted) and normalized amplitude should be anti-correlated, with large amplitude phase variations having a small phase offset due to the inefficient heat transport. However, neither of these are observed.
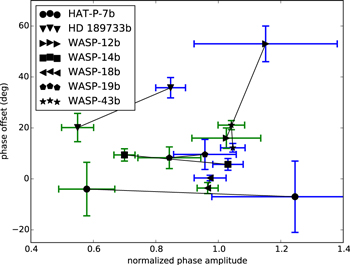
Figure 1. Phase offset vs. normalized phase amplitude for seven hot Jupiters. Blue is 3.6 μm and green is 4.5 μm. Each planet is denoted by different symbols, and the two wavebands for a given planet are connected by a line to guide the eye. The normalized phase amplitude is always greater at 3.6 μm than at 4.5 μm.
Figure 1 collects the data from seven hot Jupiters for which we have multi-band phase curve observations. The x-axis shows the normalized phase amplitude (the flux contrast of the dayside and nightside divided by that of the dayside). One can see that blue points (3.6 μm) are always to the right of green points (4.5 μm) for each planet, meaning 3.6 μm observations exhibit larger day-night contrast. According to the previous argument, we would naively expect the blue points to be to the upper left of the green points.
Predictions from a 3D Radiative-Dynamical Model
The authors explore these phenomena by running a radiative-hydrodynamic simulation of a hot Jupiter, HD 1890733b, assuming thermo-chemical equilibrium. Their model produces theoretical phase curves with greater relative phase amplitude and greater phase offset at 3.6 μm than at 4.5 μm, in agreement with the data. This demonstrates that the opacity cannot be simply presented by a 1D model. Instead, the photosphere can be a convoluted function of both longitude and wavelength, as shown in Figure 2. First of all, the day-night temperature contrast is truly decreasing with increasing pressure in general, as we expect. Looking at the photospheres in different wavebands, we find that a single waveband probes different pressures depending on the longitude. The contribution function (showing the vertical contribution to the emission flux) in the right panel shows a significant contribution at 4.5 μm from the upper, cooler regions on the dayside relative to 3.6 μm leads to a smaller phase amplitude. The result is that the effective photosphere in each band does not necessarily maintain its relative position as one moves around in longitude.
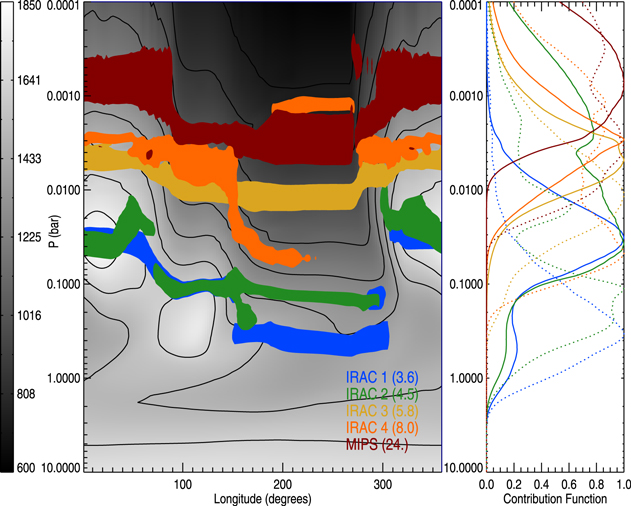
Figure 2. Left: the peaks of the contribution functions for the IRAC and MIPS bands (colored bands) over-plotted on the temperature in K (gray scale) as a function of pressure and longitude along the equator. The noon longitude is at zero. Right: the vertical contribution functions at noon (solid) and midnight (dotted) locations.
Multi-wavelength maps
A further investigation to understand how the global opacity distribution changes is shown in Figure 3, where we can see the total opacity (the absorption of all the gaseous molecules) as a function of temperature and pressure. By following the same pressure across each of the plots, we can roughly visualize how the opacity changes along the longitude. Interestingly, the opacity at 4.5 μm increases when moving from night to day, while at 3.6 μm it decreases. This feature makes the effective photosphere at 4.5 μm higher on the dayside, where the atmosphere is cooler, and hence reduces the day-night contrast (phase amplitude). The behavior of opacity is due to the CH4-CO transition: CH4 is favored at lower temperatures and has strong absorption at 3.6 μm; CO is favored at higher temperatures and has strong absorption at 4.5 μm. Therefore, the photosphere at 3.6 μm can be higher than at 4.5 μm in the cool region.
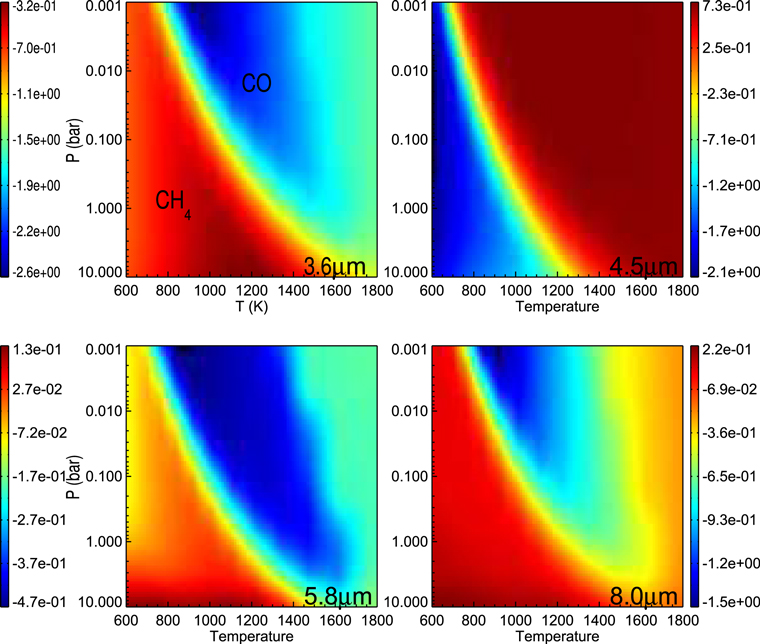
Figure 3. Log of the total opacity (in cm2 g-1) due to molecules (CH4, CO, H2O, and CO2) as a function of temperature and pressure at 3.6, 4.5, 5.8, and 8.0 μm. Thermo-chemical equilibrium is assumed at each temperature and pressure. The obvious feature running diagonally through all of the plots is the change in opacity as the dominant carbon-bearing molecule switches from CH4 in the lower left to CO in the upper right.
Unfortunately, the convoluted photospheres complicate the interpretation of multi-wavelength phase curves. In particular, the authors show that the classic 1D assumption that different wavelengths probe different pressure layers is incorrect: it is true only at one longitude, but the order of the layers changes from one location to another. This is a complication worth tackling soon in order to construct multi-dimensional maps of hot Jupiters.
Author