Happy anniversary to us! Ten years ago, on November 30th 2010, Astrobites released its first article. Nearly every weekday since then, a new article was published on Astrobites. We have covered over 2,700 research papers from the ArXiv with the goal of summarizing the most recent astronomy research and making it available and accessible to undergrads and the public. In today’s post, we summarize the growth of the site over the past decade in charts and visuals, from authorship to readership and beyond.
Astrobites Authorship Growth
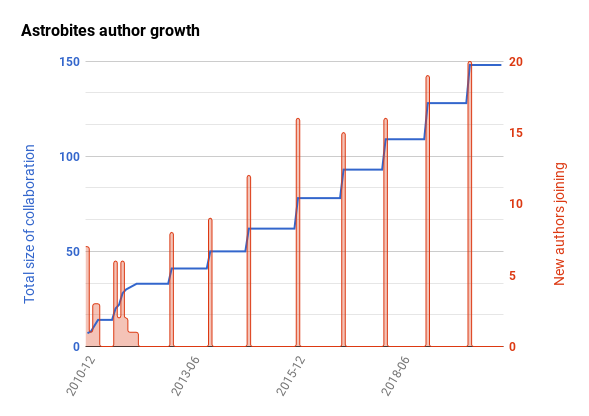
Astrobites started in 2010 as an initiative between five astronomy graduate students at Harvard University (see our interviews with some of them here). Since then, the collaboration’s authorship has grown both in number and in global reach. In total, nearly 150 graduate students have been part of the regular Astrobites rotation, from universities around the globe. Take a look at how we’ve expanded in Figures 1 and 2 below!
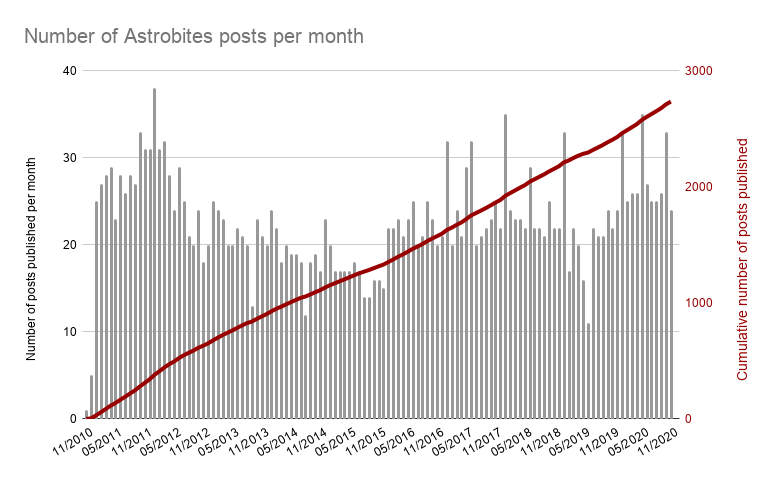
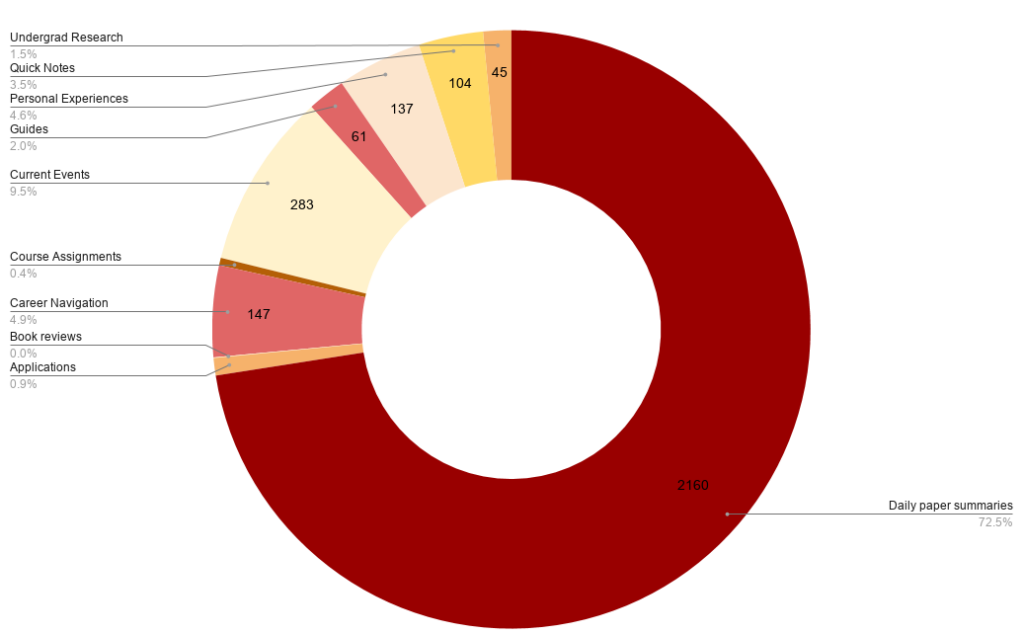
In addition to our ever-growing number of authors, we’ve been publishing a new post (and sometimes more than one!) pretty much every day for the past ten years. On average, we have published 22.6 posts each month with a standard deviation of 5.6 posts, for a cumulative total of 2736 posts as of December 1st, 2020! (See Figure 3). Notably, we see a spike in posts each January and May/June starting in 2017 thanks to our partnership with the AAS to cover the speakers and events of the biannual meetings. Of our published posts, the vast majority (2160) have been our standard daily summary posts, with the next-most-common types of posts being about personal experiences or current events (Figure 4).
Astrobites Readership Growth
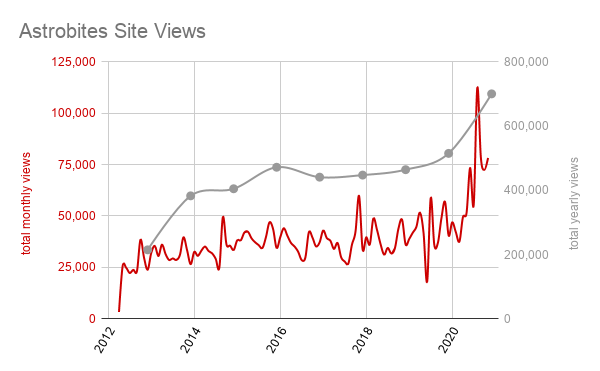
Our site couldn’t have had nearly as much success as it has over the past decade with YOU, dear readers! We’re delighted that we’ve had a consistent, and consistently growing, readership base over the past ten years. Take a look at Figure 5! We’ve seen a noticeable spike in our readership this year (we haven’t delved into the reasons for this, but some of our authors speculate that this could be due to a combination of the ongoing COVID-19 pandemic and our increased posting related to political and cultural events of 2020).
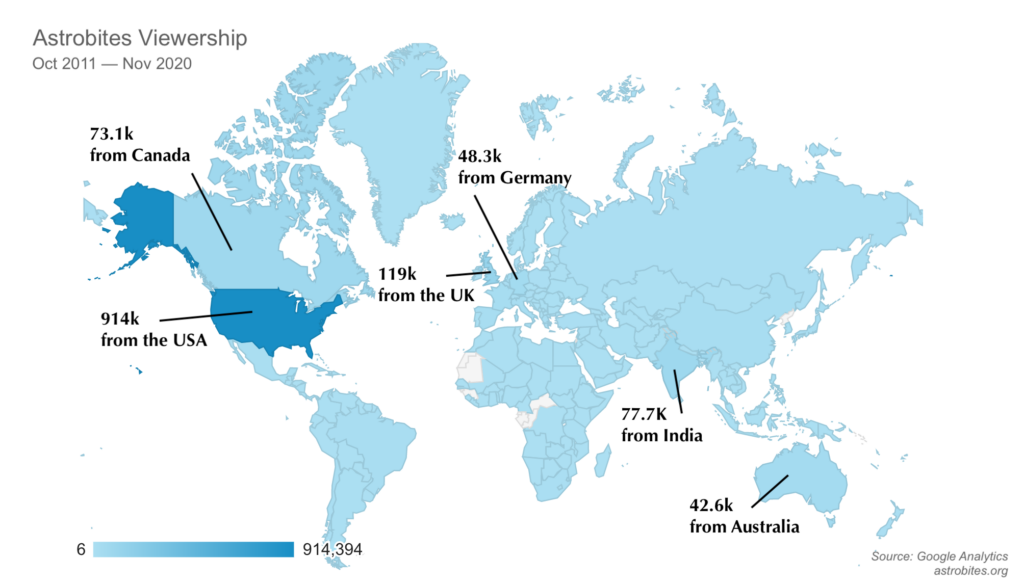
And finally, we’re so proud that Astrobites has been able to reach so widely around the world (Figure 6). Our readers come from all over, and we’re excited to continue our outreach efforts for the years (and hopefully decades) to come!