This year’s Earth Week x Astrobites kicked off with hosts Prof. James Lowenthal and Ryan Wyatt (see here for their biographies), bringing their views and experiences on “Climate Communication in Education Spaces”.
Their focus was on how to bring climate change concepts to introductory Astronomy courses and to a wider public with an interest in astronomy, while maintaining an uplifting outlook on the subject.
Summarizing the session in two parts, we will first look at how Prof. Lowenthal introduces alternative approaches to discuss climate topics in the classroom, followed by how Ryan Wyatt brings environmental issues to a wider public.
If you happened to have missed the session, the recorded version can be found here, along with closed caption text for the talk. At the end of this post we also give a summary of the resources talked about during the session.
James Lowenthal: “Climate Communication in Education Spaces”
Dr. Lowenthal is the Mary Elizabeth Moses Professor of Astronomy at Smith College.
Prof. Lowenthal started off with summarizing his more traditional approach on teaching climate in Intro to Astro courses: providing a wide range of information on e.g. the greenhouse effect, ozone creation/destruction, giving compelling evidence along with good visualization and analogies, by giving local examples of the effects of climate change, short-term and long-term effects on the climate, extreme cases, and so forth. The main emphasis should be that the science on this matter is settled: the climate is changing too fast. There is no substantial scientific opposition to the human-made acceleration of climate change.
He also points out that most students have already seen some impact of climate change. In fact, many young people in this context have crisis fatigue, being overwhelmed by the sheer amount of negative effects and consequences the climate crisis presents.
Proposing a different approach, Prof. Lowenthal explains that students might benefit more from an interactive approach on climate topics, focussing on how to solve the climate issue instead of on the – often dire – consequences if no efforts are made. For this, he uses the C-ROADS tool (see Fig. 1 for the tool’s interface), a simulator that shows how global temperature increase is affected by changing current and future policies of six major regions (US, EU, other developed countries, China, India and other developing countries).
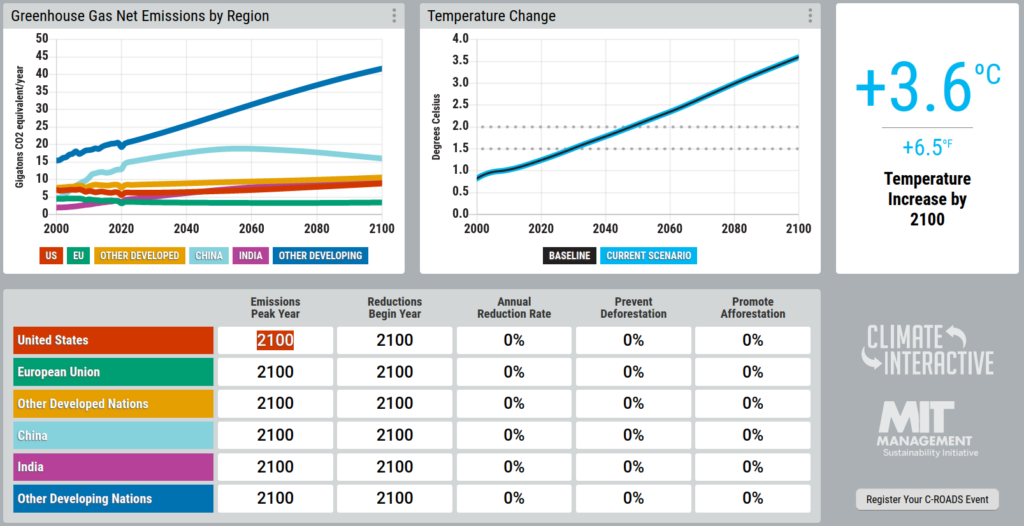
The class can become a highly interactive role-play set up of a climate summit by dividing the students into these six regions plus an additional three groups (fossil fuel lobbyists, climate activists and journalists) and providing all 9 groups with some general overview of their realistic capabilities.
The whole exercise shows which commitments these six regions would need to make in order to reach the Paris Agreement goal of a maximum of 1.5-2° global warming by 2100. Also, perhaps even more importantly, it shows the necessity for collaboration between these regions in order to reach this goal. In short, this alternative approach to bringing climate change to students shows how this problem can be tackled on an international scale without becoming unrealistic, ultimately delivering a hopeful, less despairing sense for the future.
Prof. Lowenthal proposed another angle on bringing climate change to classrooms. It starts with bringing a more hands-on approach to climate modeling. The tool he uses for this is the Monash University simple climate model, where students can dissect several contributors to climate change, with the ability to look at local changes. In line with this DIY climate modeling, students then design and carry out a climate outreach project, supplemented with a TEDx-style talk about climate change.
This approach focuses mainly on science communication training, where part of the inspiration for this training comes from the Alan Alda Center for Communicating Science, summarized in four main points:
- Distill your message: overly detailed and long explanations to make a good point do more bad than good when talking to a wide audience.
- Shed the jargon: science is filled to the brim with specialized language, making it harder to understand concepts, climate science is not free of this.
- Empathize with your audience: many people can imagine (probably from experience) a long, exhausting lecture where a person in front talks for hours at a time. You can also imagine that you will not remember an awful lot from this – so engage, interact and try to understand your audience to make a much better impression.
- Use stories for more impact: dry facts and data charts are good evidence, but they’re also cold. Real-life stories are easier for people to connect with.
Ryan Wyatt: “Putting the ‘Planet’ in Planetarium”
Ryan Wyatt is Senior Director of Morrison Planetarium and Science Visualization at the California Academy of Sciences.
Historically, planetaria have been used to display the stars in amazing detail and accuracy. This means that the main focus was on the night sky. The Morrison Planetarium, built in 1952, was no different. From the early 2000s on, computerisation and digitalisation have been increasing at a rapid pace. These days, the planetarium shows 3D visualizations of our universe, being able to fly through (simulated) space in real time. As a part of the California Academy of Sciences that is devoted to the life sciences, the Planetarium combines the worlds of far-away astronomy and more down-to-earth (pun intended) environmental themes.
Astronomy has a large advantage over many other sciences: our ‘branch offices’ (planetaria) can be found all over the globe, opening the opportunity to speak with an enormous audience. However, how well your audience receives your point depends on how well you communicate. Given the climate crisis’ urgency, we better do this well (there has even been research on this)!
The do’s of SciCom
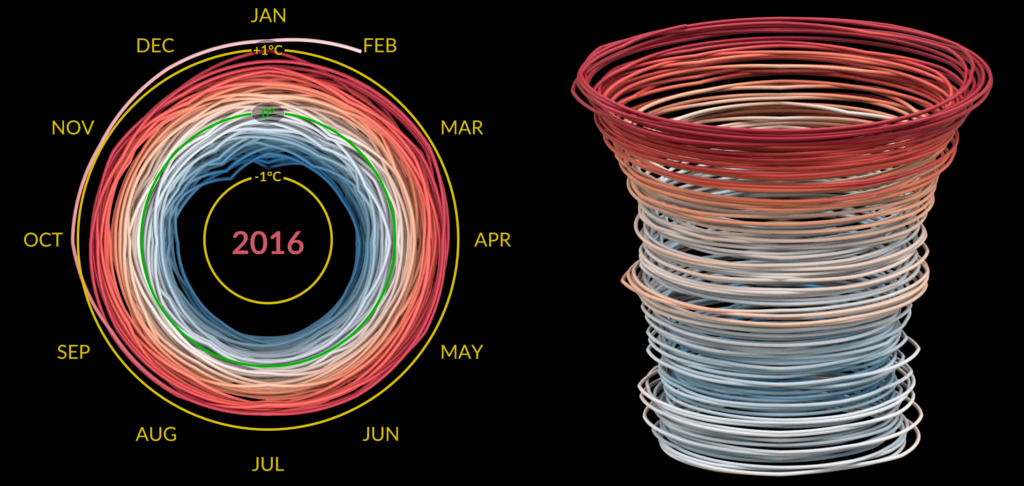
Ryan Wyatt tells us that the search for life in the universe – something often looked at in the planetarium – is coupled very heavily with how life on Earth evolved with the planet. From there, the jump to our current climate is made easily. Using the Planetarium’s capabilities, visualization of climate change can be raised to a whole new level. With the help of NASA’s Scientific Visualization Studio, data can be represented in very interesting ways (an example is shown in Fig. 2), enabling audiences from any background (including academic oriented) to better understand and talk about these problems.
Another great tool for visualization comes from the OpenSpace project. OpenSpace allows you to see the Earth far in the past (by far we mean easily 100s of millions of years), showing how much things have changed. Similarly, when we skip forward to the start of human industrialization, we can see our impact on land use, deforestation, wildfires, and more, over a very short period of time.
Being a strong supporter of good science communicators (and being one himself), Ryan Wyatt points out that the focus should not only be on what is shown, but also on what is said. Scientists tend to have their own weird language sometimes, not always understanding that the majority of people have other interpretations from what they’re saying. If you’re aware of this, bringing your message to any audience will be much easier.
The don’ts of SciCom
We want to avoid confusion at all times. Scientists might be used to many concepts and quantities that the general public is not. Due to this, representation is key here (Fig. 3 shows a great overview of what to represent and how). One thing Ryan Wyatt wants us to know is this: avoid rainbows. Beautiful as they might be, coloring data with a rainbow scheme is often not helpful (especially when you’re colorblind), with researchers pointing this out in detail as well. Scientists everywhere have been using rainbow colors for ages, even NASA has been guilty of this, while there are many and much better alternatives on the market. Shoutout to get rid of the ‘painbow’ in visualizations.
Summary of Resources
An overview of the tools introduced during the session:
- Climate Change policy simulator: C-ROADS
- Monash University simple climate model
- NASA’s Visualization Studio Studio
- The OpenSpace project
- White paper on visualization
- Scientific color maps
Additionally, feel free to contact the speakers themselves using their contact information below:
Prof. James Lowenthal ([email protected])
Ryan Wyatt ([email protected])
For running the OpenSpace software in a planetarium setting, you can also contact Dan Tell ([email protected]).
And lastly, we want to especially thank Prof. Lowenthal and Ryan Wyatt for their great presentations and sharing their expertise on astronomy and climate change with us!
Astrobite edited by: Keighley Rockcliffe
Featured image credit: Suchitra Narayana
Learn more about our Climate Change Series. We’d love to hear what you would like to see from this initiative – if you have ideas, please let us know in this google form. Find last year’s Earth Week page here.