Astrobites Authors: Keighley Rockcliffe & Katya Gozman
Title: Design and evaluation of a multi-sensory representation of scientific data
Authors: Stefania Varano & Anita Zanella
First Author’s Institution: Istituto Nazionale di Astrofisica, Istituto di Radioastronomia, via Gobetti 101, 40129 Bologna, Italy
Status: Published in Frontiers in Education: Special Educational Needs [open access]
Introduction
Scientists are the Universe’s translators. Their responsibility is to ensure that anyone can access their translation. Today’s authors argue that astronomers have not been living up to this task. Despite being one of the oldest physical sciences, astronomy has remained stagnant in its reliance on visual communication. We recognize the irony that this article itself will not be accessible to all – including blind or visually impaired (BVI) users. Astrobites is continually assessing its inclusivity and encouraging its volunteers to make their content accessible.
Some common examples of astronomy’s inaccessibility:
- Reliance on imaging and representing CCD data visually (Making astronomy accessible for blind and visually impaired astronomers)
- Rarely providing raw data alongside publication
- Using pdfs to publish on the arXiv (Inaccessible vs. Accessible PDFs)
- No use of alt-text in published journal articles (AAS Working Group on Accessibility and Disability recommendations)
- Reliance on English literacy (AIP Physics PhDs Ten Years Later: Success Factors and Barriers in Career Paths)
- Requires highly specific technology access and acumen (e.g., access and training on specific telescopes, with software, etc.)
Because of this, astronomy remains inaccessible to many – to the blind and visually impaired, to non-visual learners, to scientists whose first language is not English and more. The goal of today’s article is to convince the astronomy community that multi-sensory representations are necessary for effective and accessible learning. The authors design and assess two single-sense astronomy representations, and use their feedback to create a unique multi-sensory representation to be used as an exhibit at Palazzo delle Esposizioni in Rome, Italy.
Sound and touch representations of astronomical radio sources
The authors evaluated the ability of different sensory stimuli to communicate information effectively (see their Table 1). Each stimulus was assessed on how much information content it could represent, the ability for humans to resolve representative differences within the stimulus, and to what extent the stimulus could be misinterpreted (level of arbitrariness). The authors ruled out taste, smell, and heat representations because of regulatory reasons, their physiological impact and their subjectivity. For the first part of their experiment, the authors designed two astronomy representations that relied on sound (acoustic) and touch (haptic).
Each single-sense representation communicated position and intensity of radio sources from the NRAO VLA Sky Survey (NVSS) and the Faint Images of the Radio Sky at Twenty-cm Survey (FIRST). If available, distance and source classification information was also included from the VIMOS Public Extragalactic Redshift Survey (VIPERS) and the Sloan Digital Sky Survey (SDSS).
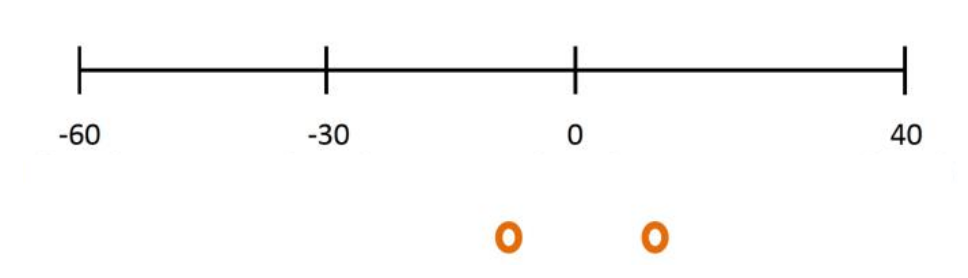
Four radio sources were included in the acoustic representation, each with a single stereo signal located along one axis (Figure 1). All sources have the same intensity of radio emission. Their distances were represented by volume and frequencies by pitch.
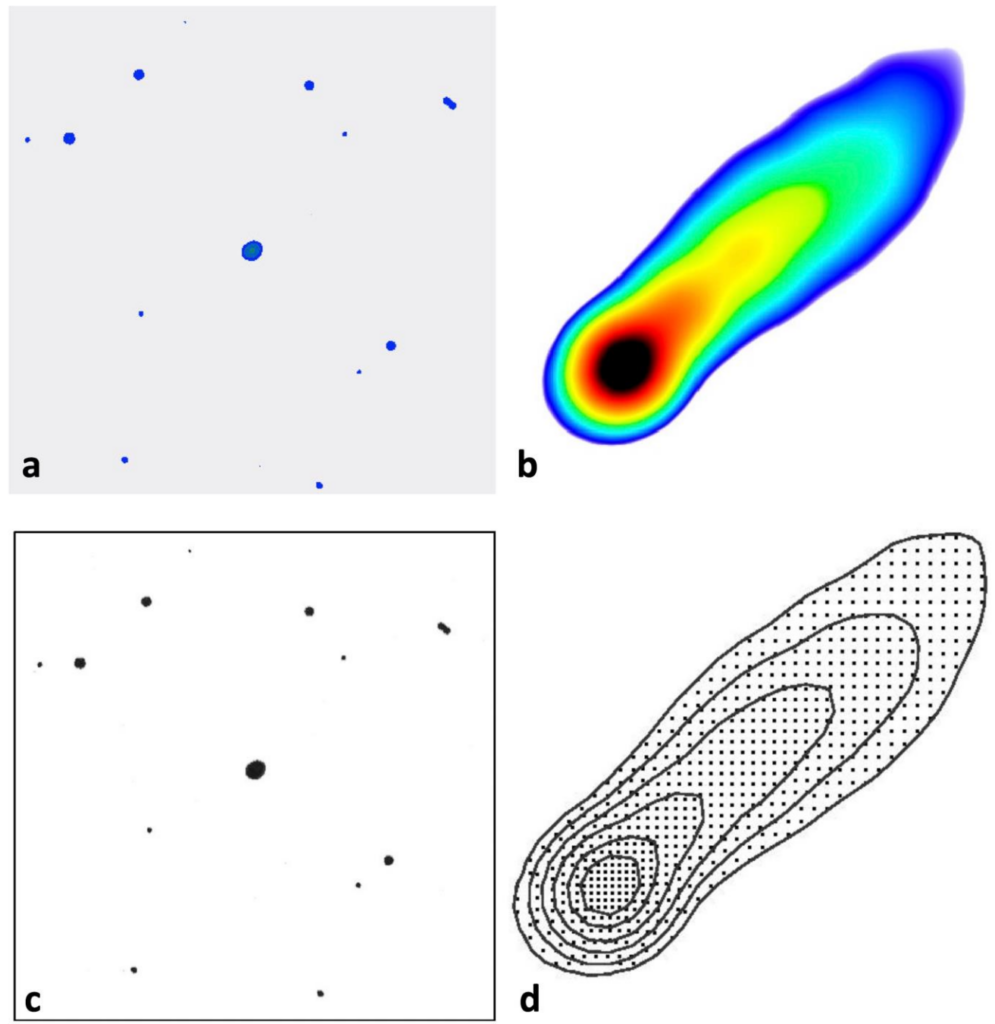
The haptic representation was designed with the help of the Francesco Cavazza Institute for the Blind and Dr. Loretta Secchi – ensuring that the project had input from professionals within optical and tactile interpretation. Figure 2a is a visual representation of a 2 deg x 2 deg field of radio sources from NVSS. Figure 2b is the visual representation of radio source 0206+35 from NVSS. Figure 2c and 2d depict the haptic representations that correspond to their visual counterparts in Figure 2a and 2b, where the dots are tactile (bumps or “relief dots”). Each relief dot in Figure 2c represents one radio source at that location. The spatial density of relief dots in Figure 2d represents the intensity of radio emission at that location – i.e., the closer together the dots are, the higher the intensity of radio waves.
The acoustic and haptic single-sense representations were evaluated by a group of 27 users of a large range of adult ages, sightedness, and scientific literacy. At first, the users were only given the guidance that “the object of this representation is a celestial map.” After the initial exploration of the representation, the authors shared how to translate the information being explored (e.g., sound volume represents distance). Questionnaires were given to the users to qualitatively assess how understandable each representation was and what pieces were the hardest to understand and/or easiest to misunderstand.
User feedback
From the tactile representation, the authors found that users easily understood that each relief dot mapped to a different celestial source (Figure 2c), but had a harder time understanding the emission intensity contours of the zoomed-in radio source (Figure 2d). For the acoustic representation, users also understood that each acoustic stimulus corresponded to one source in the sky and were able to interpret the spatial position of each source. They were also successful in associating different volumes with differing distances and could perceive different pitches. However, users had a hard time actually quantifying differences in volume or distinguishing differences in pitches. The authors concluded that it’s better to have two different representations of intensity of a source and its distance (since these are often confused), as well as to use musical instrument timbres instead of synthetic sounds to improve pitch recognition.
Sense the Universe
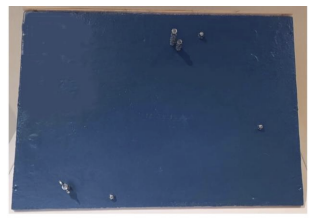
Using the feedback they received from the haptic-only and acoustic-only experiments and through a series of testing with sighted and BVI users, the authors created a final, multi-sensory representation of their radio source data (Figure 3). The final product was a plywood board with stacks of bolts screwed in at different positions (representing the positions of the sources in the sky) and heights (representing the intensity of each source). The shape of each top bolt represented a different celestial object type: galaxies, active galactic nuclei (AGN), or unknown sources. Each bolt was attached to an electronic breadboard that emits a piano sound when a bolt is touched, whose pitch represents the distance of each source.
This final product, called “Sense the Universe” was displayed at the IAU’s exhibit “Inspiring Stars” and tested with 20 different visitors (10 sighted, 10 BVI), as well as 2 BVI astronomers. At first, visitors were given time to freely explore the representation without being told how to interpret it. None of the visitors fully understood the representation without explanation, and there were no familiar features that could have been misleading or mistaken for something else they might have experienced before – for example, thinking the setup had the shape of a familiar constellation and assuming they were looking at stars visible in the night sky. The only correspondence all visitors guessed correctly was that each bolt’s position represented its position in the sky. After explaining how to interpret the exhibit, all the visitors easily understood the concepts being presented (i.e. spatial position, intensity, distance) and found the representation straightforward.
That said, this representation was not perfect, and visitors also had good feedback for improving the experience. The two professional BVI astronomers suggested adding other sensory stimuli to give more redundancy and to allow Deaf users access to the same information (in this case, the distance of each source was only interpretable through its pitch), as well as adding a measurable scale to the intensity so users could get a numerical sense of the intensity represented by a single bolt. The authors also found that the experience was improved when visitors could have emotional involvement in the exploration. As the design of the exhibit was not very aesthetically pleasing, BVI users were on a more level playing field with sighted users whose emotional involvement can derive just from the “wow factor” of seeing an image (e.g. the excitement over the first gorgeous JWST images that sighted users pored over). BVI users became more excited when hearing that the data they were sensing isn’t accessible to anyone at first – sighted or BVI – since humans cannot detect or sense radio waves without the help of technology.
In the end, the authors conclude that multi-sensory representations of astronomical data are useful in engaging any user with astronomical concepts and giving them equal access to the same information, no matter what modalities they prefer to explore the world in. The authors emphasize the need to involve experts and final users in an iterative design process – if you’re going to create a product meant to help BVI users understand a concept, it is absolutely crucial to involve BVI folks from the beginning of the process. In the future, the authors hope to test their design with more users and possibly study the effects that a user’s cultural background or scientific literacy has on their recommendations for multi-sensory designs. With this pioneering work, hopefully we’ll start seeing more multi-sensory exhibits in museums and classrooms around the world that enable everyone to explore the vast, invisible universe we live in.
For resources on making astronomy accessible, visit Astronomers Without Borders!
Astrobite edited by Lili Alderson
Featured image credit: Keighley Rockcliffe with Canva