Authors: Spencer Bialek, Sara Lucatello, Sebastien Fabbro, Kwang Moo Yi, Kim A. Venn
First Author’s Institution: Department of Physics and Astronomy, University of Victoria, Victoria, BC, V8W 3P2, Canada
Status: Submitted to MNRAS [open access]
You finally visit Montana’s Glacier National Park, snap a photo, but an entire group of hikers walk right in front of your camera! While you grumble at your interrupted snapshot, the same phenomenon is happening increasingly often to astronomers as they image our night sky. Today’s authors seek solutions that mitigate the effects of satellite streaks in WEAVE data, an upcoming wide field spectrometer that takes spectra over large areas of the sky.
Just like you know there was a mountain behind that group of hikers, there are stars, galaxies, and undiscovered worlds behind satellite streaks. The experiment carried out in today’s paper assumed fiducial properties about those satellites and trained a neural network to determine if it is possible to identify and extract the pollutant to rescue the science.
A Natural Remedy
For the most part, satellites appear bright because they reflect the sun’s rays, similarly to the moon. Today’s authors took advantage of such characteristics and approximated fake satellite spectra to roughly that of the sun. (Though, this is not perfect, as satellites themselves are made of material that will absorb and reflect at the wavelengths of those respective elements.) Unfortunately, information regarding the exact spectroscopic features of the commercial satellites themselves is not widely available.
To use machine learning on a problem, a full data set must be divided into two sets: one to train the algorithm, the other to carry out the experiment. These are called “reference” and “test” sets, respectively. The authors had 3,100 stellar spectra total from the fourth release of the Gaia-ESO Survey (GES), mainly dwarfs and giants spanning spectral types O to M. This covers a large range of luminosities and temperatures which the authors chose in order to represent a broad spectral region at optical-IR wavelengths more visible to the instrument.
80% of these 3,100 spectra were reserved to develop the machine learning model, a convolutional neural network (CNN) subdivided into 85% for training and 15% for validation. (For a primer on how CNNs operate, check out this article.) 20% of the 3,100 spectra were unaltered and reserved as the test set. But all that partitioning is just for the stellar spectra! Additionally, the authors employed 232 FLAMES-UVES spectra of the sun and sky to serve as contaminating false-satellites
The authors selected stellar spectra at random and contaminated them with a randomly selected solar spectrum applied anywhere between 0–50% of the median solar intensity. They repeated this process until they had 10,000 stars in their sample, simulating 10,000 spectroscopic messages sent to Earth, some a mix of nature and pollutant.
Following the Path of the Neural Network
After setting up their experiment, the authors asked three questions of their CNN: (i) is a given spectrum contaminated? (ii) what are the properties of the underlying star? (iii) is the stellar spectrum extractable? As you can imagine, this becomes a nontrivial set of questions when the contaminating spectrum contains very similar elements!
The authors addressed the first question, whether or not there was any contamination, using a classifier neural network code called StarNet. The output was “classified” as a score between 0 (clean) and 1 (contaminated). The second question was pursued via a regression neural network, a type of neural network that explores how related the independent and dependent variables are to one another. The third question, and perhaps the most creative, the authors answered using Wave U-Net, another classifier neural network, but one normally used to isolate raw audio waveforms such as bass, guitar, drums, or voice.
Because these three questions are slightly different phrasings of the same central idea, the authors found all three methods lead to slightly different results. The authors elected to combine their methods in an ensemble and measure the detection and probability of a spectrum being contaminated.
The Bright Side
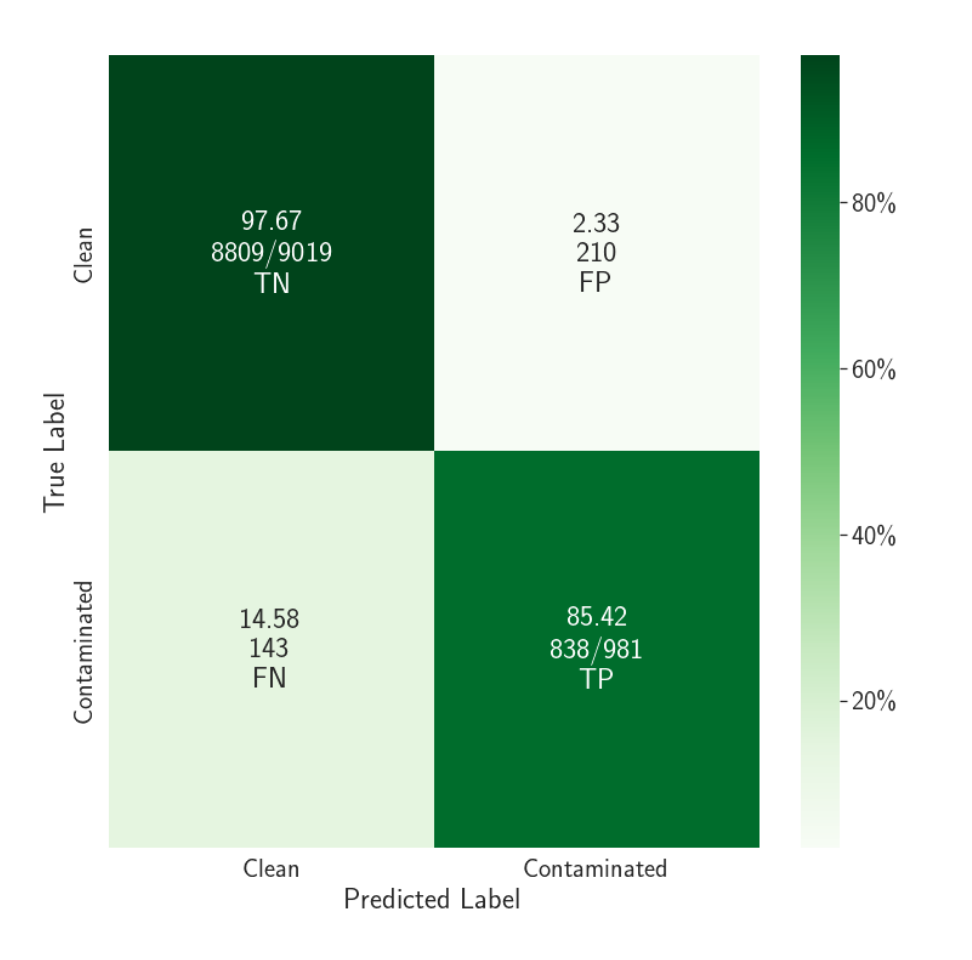
Figure 1 shows the result of the combined methods in a handy confusion matrix. (For reference, a spectrum was considered “contaminated” if it was >1% solar spectra, and the neutral network labeled something “contaminated” if it was >70% sure of this.) Their classifier correctly identified much of the data (97.67% of the clean data were correctly identified, and 85.42% of the contaminated data were correctly identified), only falsely labeling contaminated spectra as “clean” on 14.5% of its attempts.
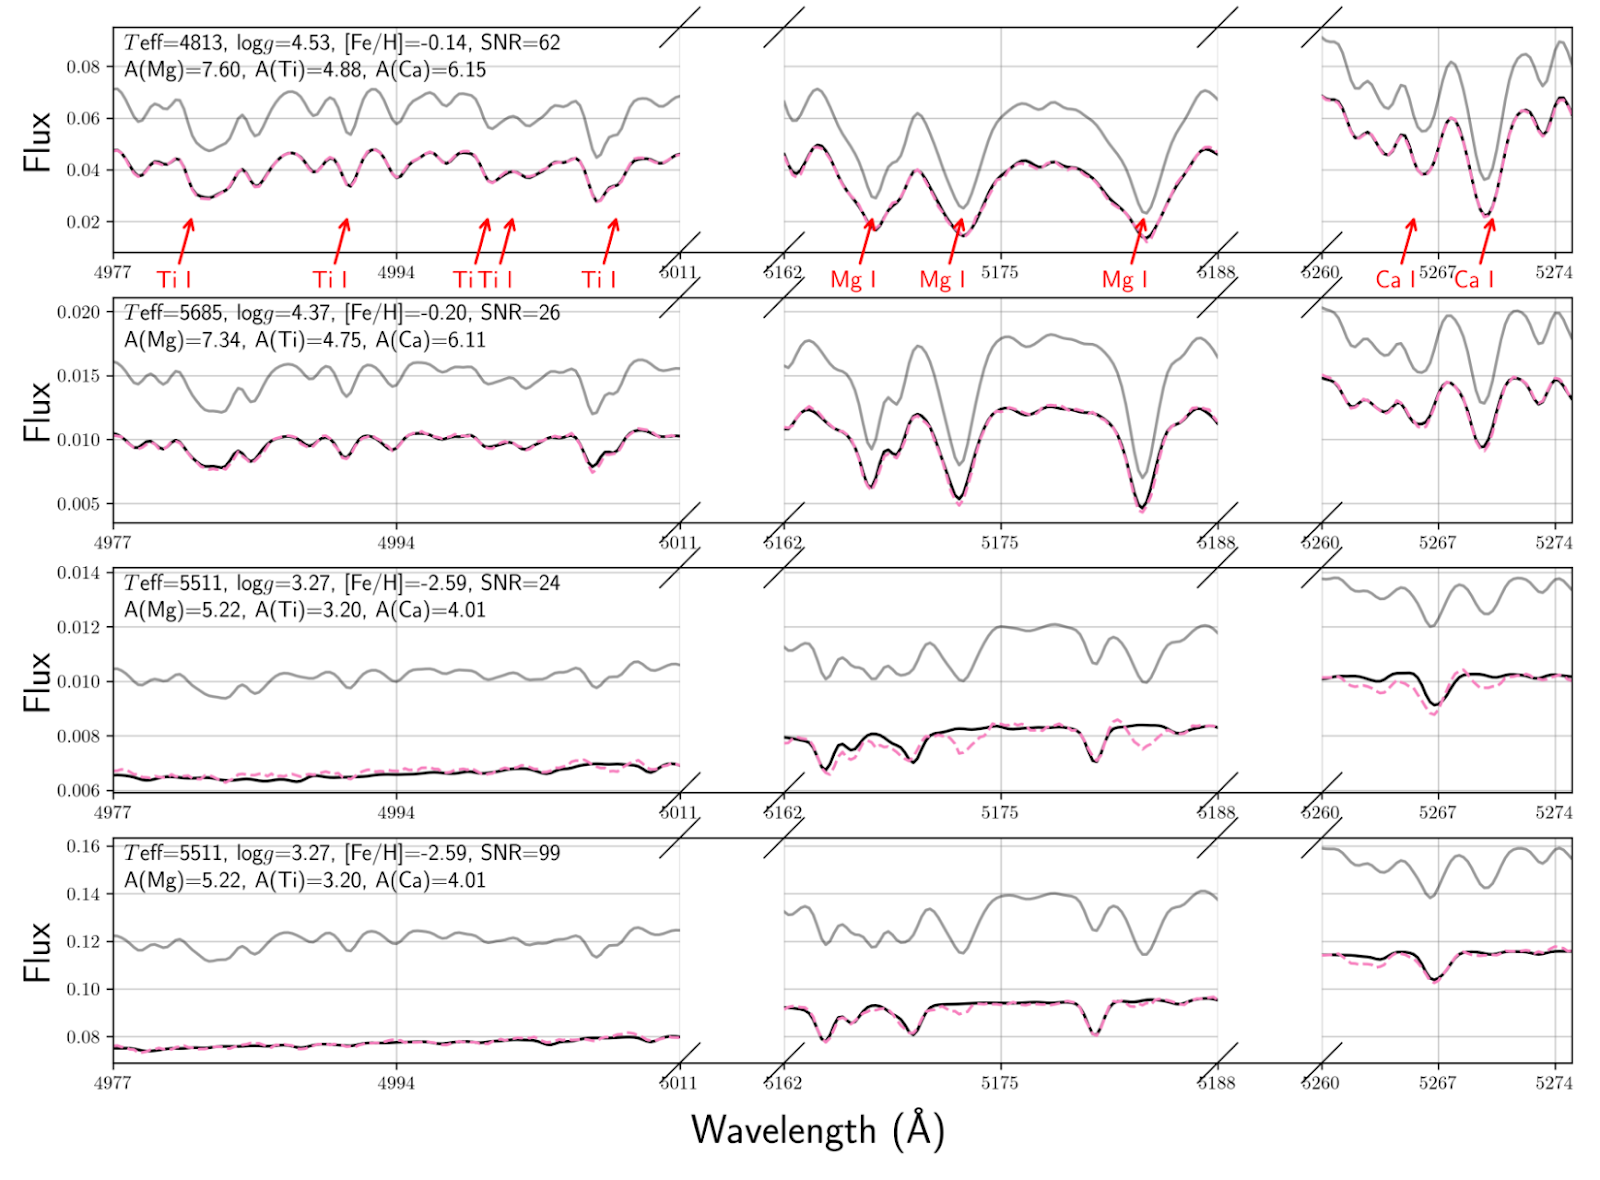
When applying Wave U-Net to extract the stellar spectrum, the authors were capable of doing so on those with 40% solar contamination specifically in stars with strong Mg, Ti, and Ca features. However, they found much larger errors around deeper absorption features in stars with low metallicity or fainter detections (Figure 2). In particular, the Wave U-Net model works very well; its 1 sigma uncertainties were 0.46% in the low (<10%) contamination regime and <1% in the high (40-50%) contamination regime when sifting out clean spectra from the contaminated sample.
Trail Conditions
The authors note that the majority of low contamination (<5%) spectra sneak by unflagged. Unfortunately, the case of low contamination is also predicted to be the most common. Moreover, it is difficult to recover qualities, such as surface gravity and metallicity, of stars that are sun-like hidden underneath a satellite’s sun-like contamination. This also means one is unable to study sun-like stars with as much confidence as in the case of pristine, uninterrupted data.
The authors also found that one of the most reliable factors for detecting a contaminated spectra becomes evident when comparing the radial velocities of the stellar and contaminating source. For stars with a high redshift due to motion, their spectral properties are sufficiently shifted away from the affected wavelengths of satellite pollution, where satellites with solar spectra travel at a much different speed than the underlying star.
As the authors identify, a large caveat to the experiment is that the underlying assumption, that satellite interference is perfectly solar, will not always hold. Each company, such as SpaceX, OneWeb, and AST SpaceMobile, craft satellites out of slightly different materials and therefore their albedos will reflect different spectra. The authors carefully note that “the results in this paper should be interpreted as the best case scenario of knowing the characteristics of contamination completely.”
The exposures taken for WEAVE will be on the order of 600-1200 seconds, a beautiful opportunity for stellar astronomy, but a risk in satellite avoidance. Longer exposures mean greater sensitivity to find faint sources, but it also means one can more easily saturate the detector with light. A longer exposure also means there is a greater chance for more satellites to run amuck in one’s field of view.
The authors are hopeful that if more satellite companies provide wavelength-dependent data of their crafts’ spectral properties, this same experiment can be carried out more effectively. However, the additional caveat holds that interrupted data will always lead to increased uncertainty, as the practice remains that we are recovering an image that has been interrupted and we can never be 100% sure what happened behind the streak. While the pursuit of space science lends itself to grand ideas of the farthest reaches of space, astronomers must now consider that which affects our foreground, increasingly relying on compromise between industry, policy, and scientists.
Astrobite edited by Pranav Satheesh
Featured image credit: Public Domain via Wikipedia, edited by the AstroBite Author