Title: Estimating Ejecta Masses of Stripped Envelope Supernovae Using Late-Time Light Curves
Authors: Annastasia Haynie, Anthony L. Piro
First Author’s Institution: University of Southern California
Status: [Submitted to] Astrophysical Journal
Why do supernovae get so bright?
Supernovae are extremely violent explosions in stars that happen during or after a star’s death. However, when we detect supernovae, we don’t see the explosion. In fact, the explosion itself is often outshined by something else. In the case of the stripped envelope type Ib, Ic, and IIb supernovae (check out this amazing bite explaining the zoo of different types of supernovae), the radioactive decay of nickel-56 is often the primary source of energy that powers the light curve.
As a massive star evolves and approaches old age, it develops an “onion” structure, with layers of progressively more dense elements closer to the core of the star, with iron in the center (see Figure 1, and these bites where I explain this in more detail!).
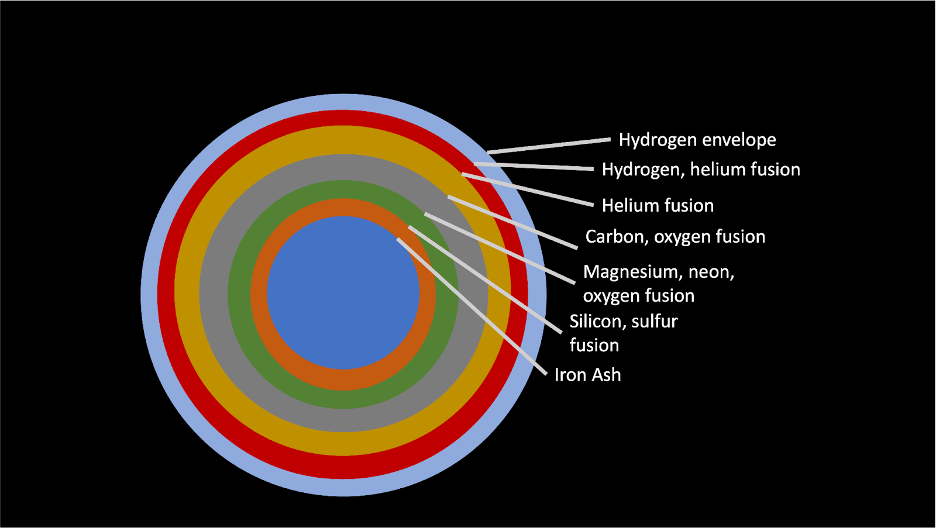
Although the presence of iron in the core of the star signals that it is close to exploding, a tiny amount of elements heavier than iron is produced. Small amounts of Nickel-56 are produced in the cores of these stars right before the star’s core collapses and a supernova ensues. That’s it! This tiny amount of nickel is the primary engine for driving the light curves of many supernovae!
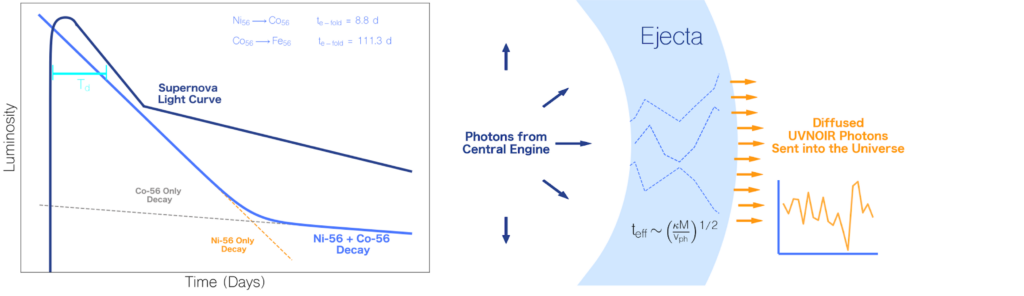
It just so happens that nickel-56 is a very radioactive isotope. It has a radioactive decay timescale of about 9 days and releases about 1 kilojoule of gamma-ray energy through radioactive decay per gram per second. This is almost half of the energy stored in an AA battery!! Nickel-56 radioactively decays into cobalt-56, which is also radioactive! It releases about the same amount of energy and has a slightly longer decay timescale of 111 days. Cobalt-56 finally decays into the stable iron-56. For the first several months after the explosion, this decay chain spews out gamma-ray photons from the center of the explosion (light blue line in left panel of Figure 2). However, this luminosity is not necessarily what we see. The gamma ray photons that are emitted from this central source then have to slowly diffuse through (random walk, right panel of Figure 2) the dense ejecta launched by the star during the explosion. So, before we get to see or detect the supernova light curve, the photons have to diffuse through this thick layer of ejecta, meaning we see a smoothed-out and diffused light curve (dark blue line in left panel of Figure 2). This diffusion is the cause of the typical rise and peak of supernova light curves.
What about the Ejecta?
Let’s think more about this ejecta that’s launched off the star. The star just had a violent explosion, expelling a large fraction of its entire mass. This ejecta then expands outward at ~10-20 thousand km/s. As it moves outwards, the ejecta thins out, becoming less opaque and dense over time. Therefore, the ejecta becomes more transparent and absorbs less and less of the energy emitted by the radioactive decay process. In fact, we do see this in real supernovae! The late time light curve of a supernova approaches the exponential decay we expect to see from just a simple radioactive decay model.
And finally, the paper!
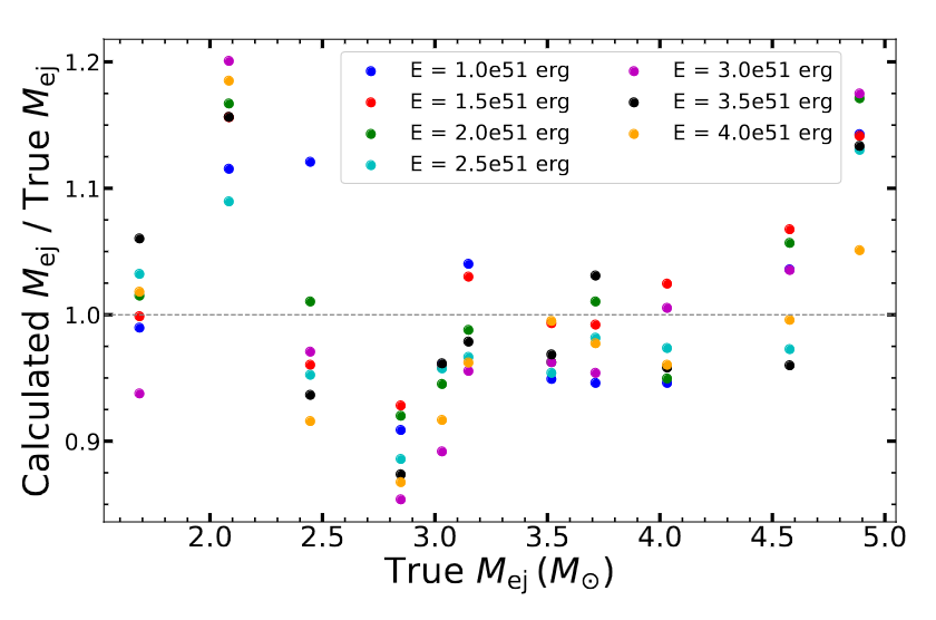
Today’s paper discusses this phenomenon. They attempt to connect the slope of the late-time supernova light curve to the mass of the ejecta. As the ejecta thins out over time, fewer gamma-ray photons emitted by the radioactive decay are absorbed by the ejecta, allowing them to “leak out”. We do not detect the light from these gamma-ray photons because they never have the chance to be diffused by the ejecta and converted into optical light. By measuring the slope of the late-time supernova light curve, one should be able to understand the rate by which the ejecta is thinning out. Specifically, the slope should tell us about the properties of the ejecta! The authors of today’s paper use this to connect the slope of the light curve to the ejecta mass. The authors simulate several explosions, each with a different ejecta mass and explosion energy, and find that this method achieves within 20% of the true ejecta mass. By simulating over a range of ejecta masses and explosion energies, the authors are able to almost recover the ejecta mass (see Figure 3)
Without this method, the ejecta mass can only be partially derived. The most common way to model supernova light curves is by the Arnett model. In the Arnett model, one derives the total nickel-56 mass to describe how bright the light curve is, and the effective diffusion time (see right panel of Figure 2), which is related to how much diffusion is happening (how wide the light curve peak is). The diffusion time is a function of the ejecta velocity, ejecta opacity and ejecta mass. Therefore, the Arnett model only measures the product of ejecta mass, ejecta velocity, and opacity. Through the Arnett model, it is impossible to discern just the ejecta mass. However, ejecta mass is an extremely useful property of supernovae! Since the ejecta is a large fraction of the mass of the star that exploded, the mass of the ejecta gives a constraint on the lower mass of the original star. By understanding supernova ejecta masses, we can far better understand the types of stars that explode and for the first time disentangle whether different mass ranges of stars result in the different types (e.g. Ib, Ic, IIb) of stripped-envelope supernovae.
Future Avenues
In all, this paper represents an important step forward in the modeling of supernova ejecta. Other papers have suggested similar methodologies for type Ia supernovae, but none have been suggested for stripped-envelope supernovae. We have long known that massive stars (stars with mass larger than 8 solar masses) which undergo core-collapse result in stripped envelope supernovae, but it is unclear whether any massive star can result in any type (e.g. Ib, Ic, IIb) of stripped envelope supernova. Little is known about the range of masses that can result in stripped envelope supernovae, and therefore little is known about the stars that result in stripped envelope supernovae. With the results of this paper, we can learn much more about how stars lived before their bright and explosive deaths!
Astrobite edited by Sonja Panjkov
Featured image credit: Image of the host galaxy of SN 2023ixf, M101 (The Pinwheel Galaxy), along with the location of the supernova. Credit: Travis Deyoe, Mount Lemmon SkyCenter, University of Arizona. Adopted from figure 1 of here, edited with this