Authors: Kocevski, D. D., Finkelstein, S. L., Barro, G., et al.
First Author’s Institution: Department of Physics and Astronomy, Colby College, Waterville ME, USA.
Status: submitted to ApJ [open access]
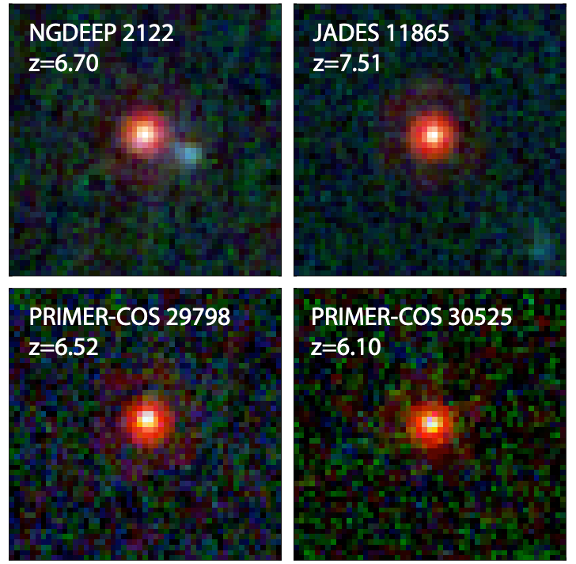
Lurking behind a thick red blanket of gas, supermassive black holes are rapidly growing in very compact galaxies known as Little Red Dots (LRDs, you can read more about them here). It’s thought that LRDs host some of the least massive supermassive black holes (SMBHs) that we’ve observed in the early universe, with masses between 1 and 10 million times the mass of our Sun.
SMBHs that are actively growing by accreting a lot of matter are known as active galactic nuclei (AGN), and while we think that AGN play an important role in galaxy evolution and the reionisation of the universe, their exact role is still unclear. Generally, the AGN we observe are very bright, but we think this is at least partially due to the fact that it’s easier to observe brighter objects, and this bias is even larger when we’re observing objects at larger distances. So, observing LRDs, which are thought to be dimmer AGN, can help us address the bias and further our understanding of AGN.
The authors of today’s paper use the near-infrared camera (NIRCam) onboard the James Webb Space Telescope (JWST) to observe 341 LRDs with redshifts ranging from 2 to 11 – that’s a range of almost 13 billion years! All of the observations were taken in legacy fields – these are areas of the sky that have been extensively studied by many different telescopes, essentially concentrating scientific efforts, rather than scattering them (literally) all over the universe. The authors also got follow-up spectroscopy using the near-infrared spectrograph on JWST for 17 of the LRDs, and found signatures of AGN activity in all of them.
A Novel Selection Technique
The most accurate measurements of redshift require spectroscopy. This allows you to identify emission lines with a known rest-frame wavelength and see how far they’ve been redshifted. However, spectroscopy is a very expensive observational technique that requires long exposure times – especially at high redshift – so you don’t want to waste observational time looking at sources that might not even be in the redshift range you want to observe. Luckily, astronomers have found a way to use photometry to estimate redshifts and build up samples that most likely have the right redshifts for follow-up spectroscopy.
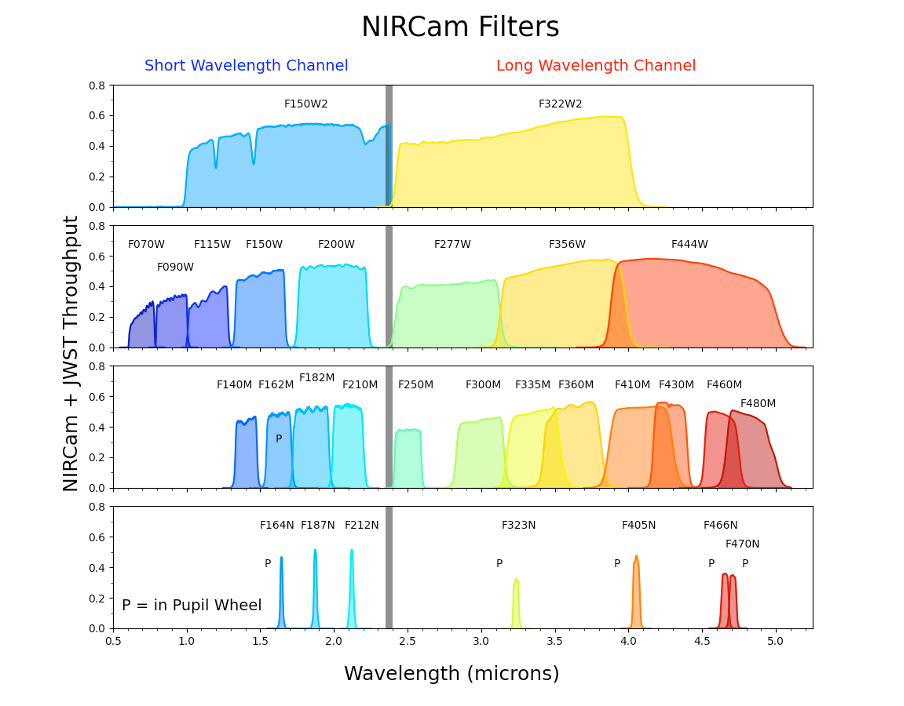
Photometry basically tells you how much light a source is emitting within a specific wavelength band (rather than at a single wavelength, as in spectroscopy). You can see the different wavelength bands observed by NIRCam in Figure 2. Sometimes, a spectral feature will happen to lie between two bands and this can be seen as a difference in energy in the two bands (this is referred to as colour). For example, some galaxies show a significant increase or decrease in their spectrum in between two bands, meaning that one band will be much brighter than the other. The redshift of the galaxy determines which bands can be used to observe the feature.
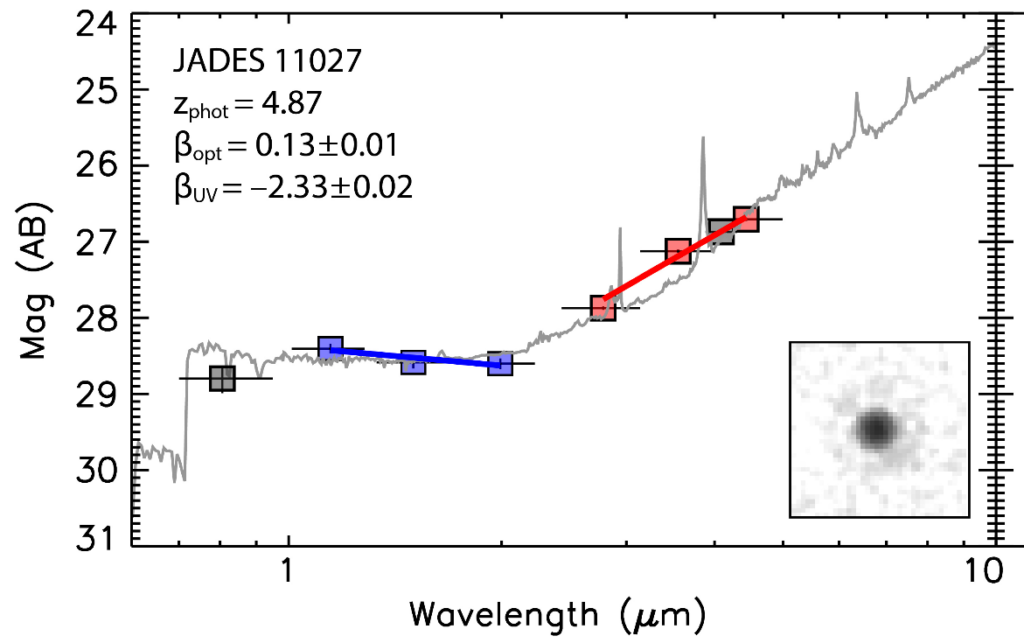
LRDs have a very specific shape to their spectra – in the optical wavelengths, the slope rises towards higher wavelengths, and in the UV, the slope rises towards lower wavelengths. This creates a distinctive V-shaped spectrum (see Figure 3), which can be detected in the photometry. Unlike previous selection techniques, the authors of today’s paper look at multiple bands to identify this “V” in the spectrum, rather than just looking for specific colours in two bands. This allowed them to find LRDs at a broader range of redshifts, and also eliminated some false positives.
A Window into Hidden Phases of Galaxy Growth
The authors found that most of the LRDs were detected at redshifts between 4.5 and 8 (a timespan of about 700 million years). This could suggest that LRDs represent a phase of galaxy evolution and supermassive black hole growth that is common in this redshift range. If LRDs are a common kind of galaxy in this epoch, it could mean that early galaxies grow “inside-out”, meaning that early stars and gas are all found in a very compact central region. Having all of this gas very close to the centre of the galaxy also helps the central SMBH grow very quickly – in fact, astronomers think that 80-90% of SMBH growth in early epochs happens while the SMBH is obscured by a lot of gas. Forming stars in a small central region also means that the metals produced by dying stars will accumulate, causing the area to appear redder, which would explain the compact, red appearance of LRDs. It’s thought that after this phase, gas with a higher angular momentum is accreted by the galaxy. The high angular momentum causes the gas to spread out into a disc, allowing for star formation on larger scales.
As we saw in today’s paper, LRD observations capture a potentially crucial stage of galaxy evolution that is helping us understand how early galaxies grow into the spiral galaxies that are so common in the local universe. LRDs may also help astronomers answer key questions around how SMBHs grow to such high masses and how AGN activity impacts host galaxies. Stay tuned as JWST continues to observe more and more high redshift galaxies, leading us ever closer to unveiling all kinds of aspects of galaxy evolution!
Astrobite edited by Cesiley King
Featured image credit: Kocevski et al., (2024)