Authors: D. Narayanan, S. Lower, P. Torrey, et al.
First Author’s Institution: Department of Astronomy, University of Florida, 211 Bryant Space Sciences Center, Gainesville, FL; Cosmic Dawn Center (DAWN), Niels Bohr Institute, University of Copenhagen, Denmark
Status: Submitted to ApJ Letters
Picture yourself at a carnival—you’re surrounded by the sounds of laughter and screams from rides and the fragrant aromas of food stands abound. As you wander around enjoying the day, cries of “step right up!” catch your attention and you find yourself stopping in front of a guesser’s stand. The game is simple: you pay a couple bucks to play and just have to stand and smile as the guesser attempts to guess your weight. If they are within a predetermined range of your weight, they win and keep your money, otherwise, you win and get to pick a prize!
Analyzing observations of young galaxies in the early universe—for example, with telescopes such as JWST—is akin to playing this game: the galaxies are the carnivalgoers, the astronomers are the guessers, and the prize is an understanding of how the first generations of galaxies form and grow! However, much like in the carnival guessing game, being the guesser is not so easy. If, for example, our carnivalgoing galaxy had just had a big meal or was wearing a lot of layers (i.e., it experienced a bright, recent burst of star formation), guessing its ‘weight’ becomes increasingly challenging.
Today’s authors seek to highlight precisely this problem. The past year of observations with JWST—playing this guessing game—has appeared to challenge our understanding of galaxy populations at high redshift (i.e., in the early universe), but today’s authors contend that perhaps we have been too hasty with some of our analysis. That is, we have been estimating masses for these galaxies using models based on the entire history of a galaxy, while our observations only reflect the galaxy’s current instantaneous state. This discrepancy could lead to significant uncertainties in the derived masses.
Building models of high-z galaxies
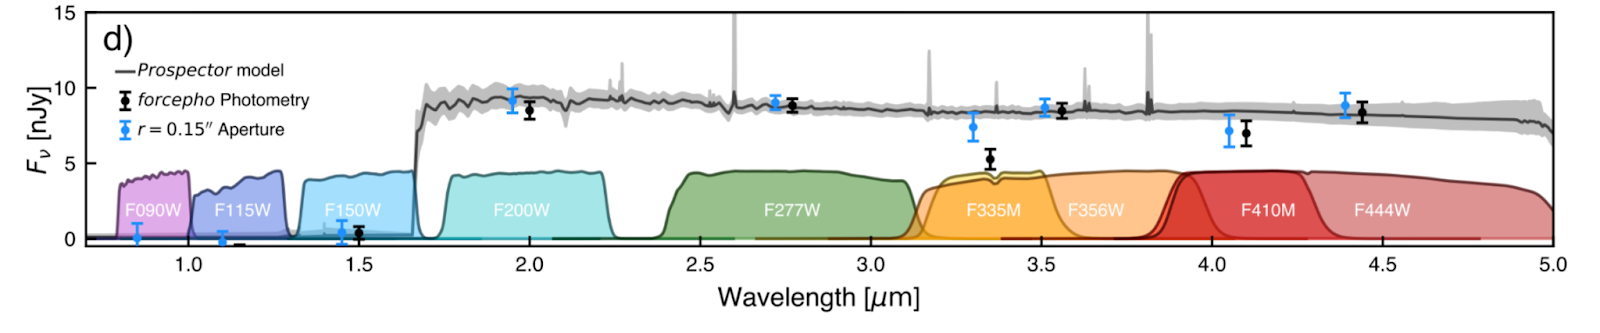
In general, many of the observations of early galaxies made with JWST have come in the form of photometric measurements of the flux (total amount of light) received from the galaxy in various broad (in terms of wavelength coverage) filters (see e.g., Figure 1). In order to connect these measurements to the physical properties of the galaxies, astronomers turn to spectral energy distribution (SED) fitting. By modeling the underlying population of sources (stars, gas, dust, etc.), astronomers can produce mock ‘photometry’ associated with a wide variety of source properties. Varying these properties and comparing them to the observed data ultimately results in a best-fit model and it is from these that we are able to compute the properties of the galaxies that we then report.
However, there are a number of challenges associated with accurately reproducing the true underlying spectrum and source population in a galaxy. For example, degeneracies between a combination of emission lines and a so-called Balmer break in the spectra of some types of stars and a Lyman break produced by absorption in the intergalactic gas can lead to confusion in the calculated distance and age of an observed galaxy (as it famously did with ‘Schrodinger’s galaxy’ last year). In kind, even when you know how far a galaxy is, if light from young, recently-formed stars dominates observed flux from the galaxy, there will be significant uncertainties in the estimated star formation history and thus the derived stellar mass, as is argued by today’s authors.
Testing the gamut of star formation histories we can imagine
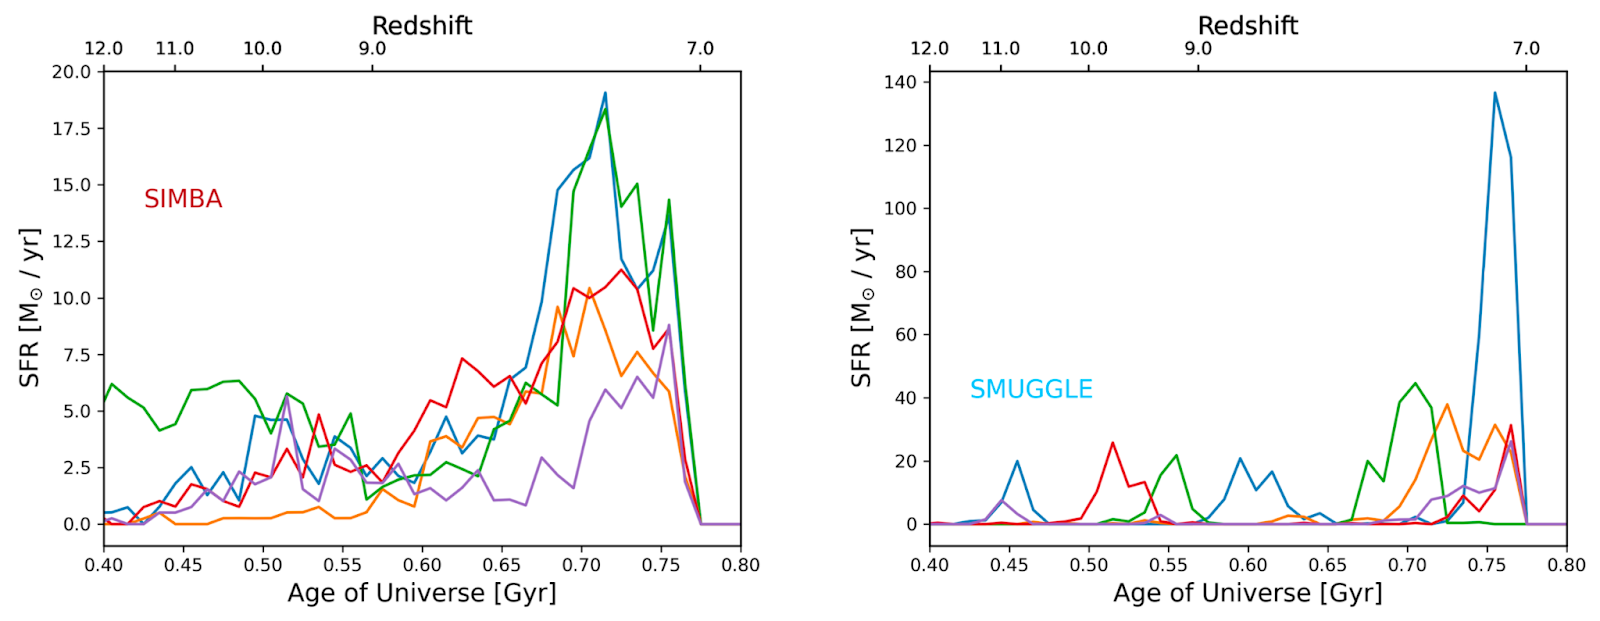
To test this contention, today’s authors simulate galaxies with a variety of star formation histories. By adopting two different models for feedback—the process(es) by which stars regulate their own rate of formation (specifically the SIMBA simulation and the SMUGGLE feedback model)—today’s authors produce galaxies that should reflect the gamut of star formation histories that we expect. In particular, the underlying physics in the SIMBA simulation results in a relatively smoother, more gradual star formation history, while a model like SMUGGLE produces more stochastic, ‘bursty’ rates of star formation (see Figure 2). By comparing the results of their analysis using galaxies simulated in these two extremes, today’s authors are able to validate the robustness of their results to variations in the true behavior/properties of galaxies in the early universe.
Today’s authors then produce SEDs for their simulated galaxies based on the modeled stellar populations and simulated dust content of the galaxies. These SEDs will serve as mock observational inputs that can be fed into a fitting code to evaluate the ability of such codes to accurately reproduce the known star formation histories of the ‘observed’ galaxies.
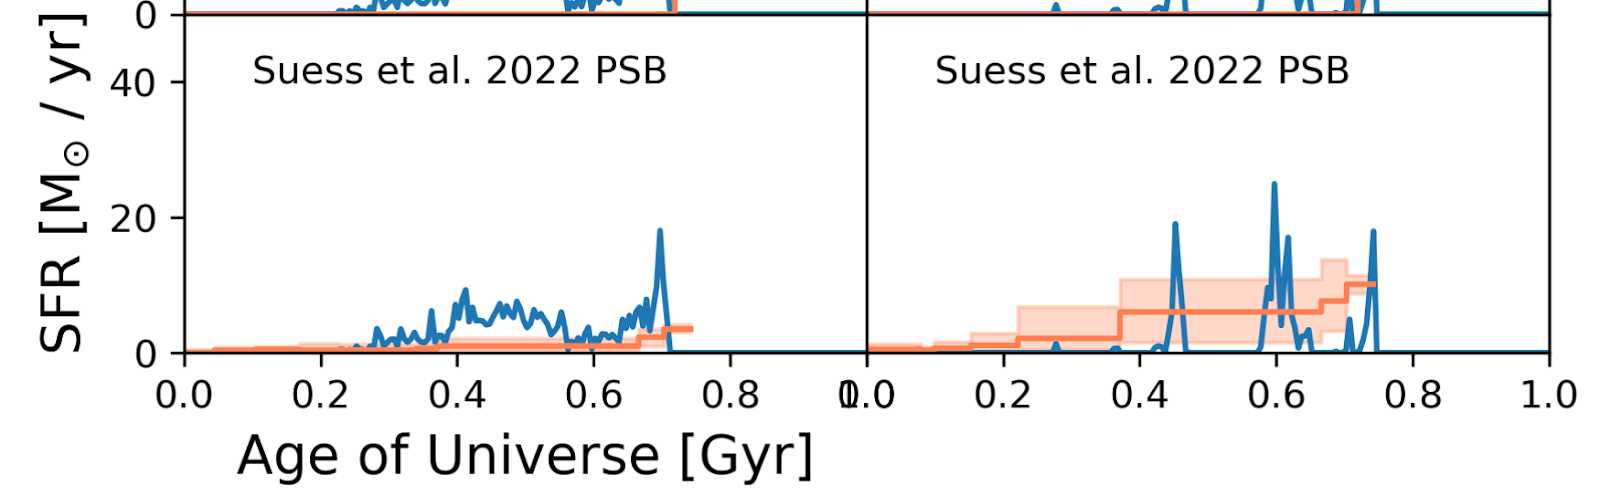
Carrying out this procedure, it turns out that while the fitting algorithm is able to produce a visually similar SED to the inputted ‘observation’, the star formation history predicted by the code is significantly different from the true history of the galaxy (see Figure 3 for an example). Indeed, even the fits that are designed to predict a relatively ‘bursty’/stochastic star formation history (such as that shown in Figure 3) are still dominated by the latest-forming (youngest) generation of stars and are not able to capture earlier star formation.
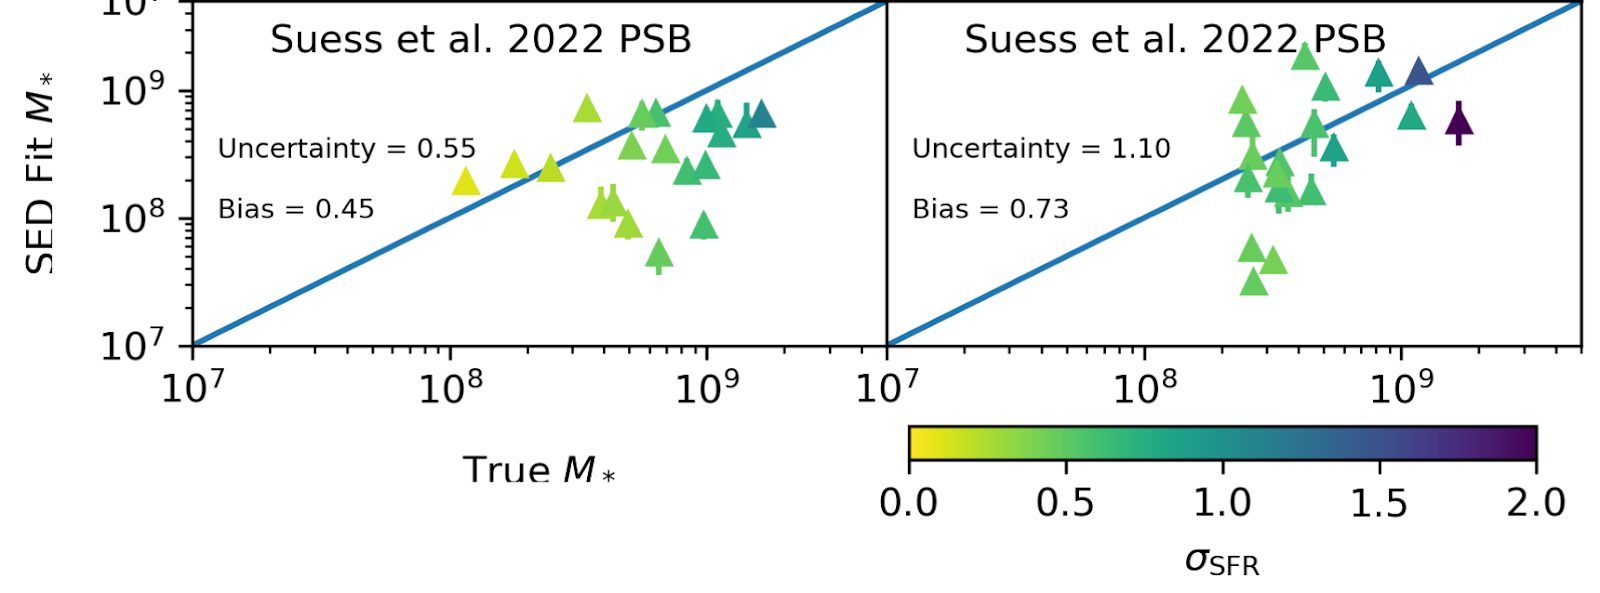
Even if the true and modeled SED are reasonably similar, if the star formation history predicted by the model significantly differs from the true star formation history of the galaxy, then the stellar mass predicted by that model will in turn be different from the true stellar mass of the galaxy. Indeed, as is shown in Figure 4, the masses predicted by the SED fit are generally fairly different from the true stellar masses of the simulated galaxies, regardless of the burstiness of the star formation history (i.e., they differ in both simulations), sometimes even by a factor of 10 or more!
In sum, it appears that using photometry alone to constrain the underlying physical properties of observed galaxies is a challenging and highly uncertain endeavor. This problem is heightened at high redshifts because the stellar mass produced in a single burst can outshine the cumulative stellar mass from previous generations of star formation in these relatively young, low-mass galaxies. As a result, it is important to treat the results of traditional SED-fitting algorithms with care until advancements in the data analysis can validate the robustness of the predictions they make.
Astrobite edited by Cole Meldorf
Featured image credit: pinterest
All Astrobites posts have a credit for a “featured image”, but I never see a featured image. What I am missng?
The featured image is the image that appears associated with the post when it is linked somewhere — for example, on the Astrobites homepage or when it is shared on social media.