Title: Direct Constraints on Strongly Interacting Dark Matter from the James Webb Space Telescope
Authors: Peizhi Du, Rouven Essig, Bernard J. Rauscher, and Hailin Xu
First Author’s Institution: Laboratory of Spin Magnetic Resonance, School of Physical Sciences, Anhui Province Key Laboratory of Scientific Instrument Development and Application, University of Science and Technology of China and New High Energy Theory Center, Department of Physics and Astronomy, Rutgers University
Status: published in Phys. Rev. Letters [open access]
Since July 2022, NASA’s James Webb Space Telescope (JWST) has been capturing images that are not only visually stunning, but also a boon to our understanding of the Universe. The authors of today’s paper analyze a set of images from JWST, but not like the ones we’ve seen before. These images were taken with a covering blocking light from the detectors, which is like taking a photo with the lens cap on! Why would anyone be interested in these? It turns out these “lens cap images” have the potential to catch a glimpse of the yet-to-be-detected dark matter.
Detectors on the near infrared spectrometer (NIRSpec) on JWST typically operate by converting incident light to an electric charge. However, if all light is blocked from the detector, an observed charge could be evidence of a dark matter interaction. The idea is that there are some models of dark matter that interact with the ordinary matter we can see around us. For some of these models, this interaction produces a charge, which is something we can observe! Making these observations with a detector on Earth would be difficult because a dark matter particle would interact with the atmosphere and/or crust first and be scattered or slowed down before reaching the detector. However, a detector in space, like the NIRSpec detectors on JWST, would bypass this issue.
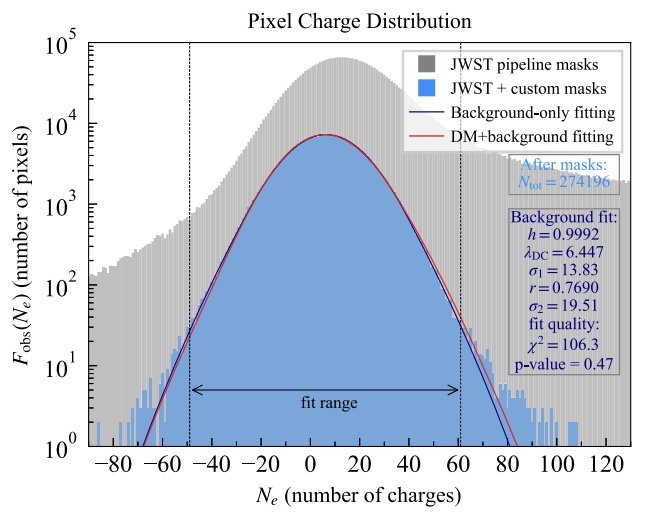
In the paper, the authors analyze the charge distribution across pixels for a set of images produced by one of the NIRSpec detectors while covered by an opaque filter. Figure 1 shows the distribution for one of these images, with the number of charges (Ne) observed by a single pixel on the x-axis, and the number of pixels that observe each number of charges (Fobs(Ne)) on the y-axis. The gray distribution was obtained by applying JWST’s existing analysis pipeline to the image, but this counted some charge observations arising from cosmic ray and radiogenic background events. After removing the charge observations associated with those events, the authors produced the blue distribution. Although the distribution peaks slightly above Ne=0, this does not mean dark matter was detected. Even with no light reaching the detector, the detectors still have an electrical current running through them, known as a dark current, and the electronics used to read out the detectors still have a level of electrical noise. The blue pixel charge distribution is consistent with these two effects. If a signal from dark matter was present, we would expect the distribution to be skewed to higher Ne since an interaction of a dark matter particle with the detector should produce charges much greater than the dark current in some pixels.
The expected pixel charge distribution for a dark matter detection can be expressed mathematically as a function depending dark matter’s mass (mᵡ), fractional abundance (fᵡ) (what fraction of dark matter is described by this model), and interaction cross section (σe) (essentially the probability of dark matter interacting with ordinary matter), as well as the detector’s dark current and readout noise levels to account for the background charge. The same function is used to express the expected pixel charge distribution for the background charge with no dark matter detection, but with σe set to 0. The authors fit the measured pixel charge distribution for the expectation with just the background charge with no dark matter detection (background-only fitting), which is represented by the dark blue curve in Figure 1. Adding a chosen model of dark matter to this fit (DM+background fitting), represented by the red curve, shows what a dark matter detection could look like.
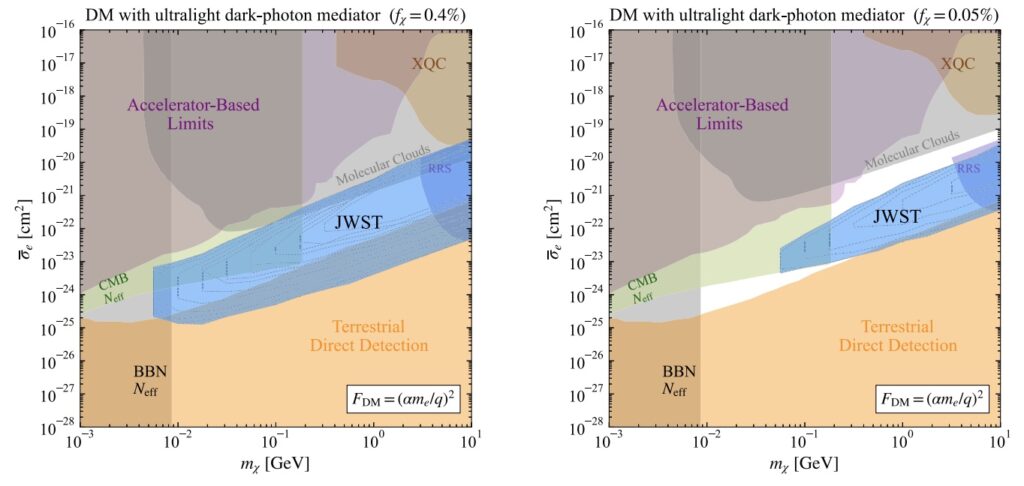
Even though the authors detected no dark matter in their measurement, they were still able to place constraints on possible values for mᵡ and σe. Using statistical methods, the authors found constraints on σe for different values of dark matter mᵡ and fᵡ. Figure 2 illustrates the constraints they found for a fᵡ=0.4% (left) and fᵡ=0.05% (right). With mᵡ on the x-axis and σe on the y-axis, the shaded regions in each plot show which combinations of mᵡ and σe are ruled out based on a lack of detection. Different colors denote constraints from different experiments, with the constraints found in this paper shown in blue. You can see that this paper’s constraints fill in a previously unexplored portion of these plots, making them a novel and valuable contribution to the search for dark matter. There is more parameter space yet to be explored, but a proposed experiment called DarkNESS uses a different detector technology with significantly lower noise that could place even more constraints using this “lens cap image” technique.
Astrobite edited by Joe Williams
Featured image credit: Wikimedia Commons