Title: VAR-PZ: Constraining the Photometric Redshifts of Quasars using Variability
Authors: Sarath Satheesh Sheeba et al.
First Author’s Institution: Instituto de Astrofísica, Facultad de Ciencias Exactas, Universidad Andrés Bello, Santiago, Chile
Status: Submitted to Astronomy & Astrophysics [open access]
A quasar is a galaxy with a super-bright core that’s powered by a supermassive black hole. This light can be brighter than hundreds — or even a thousand! — of normal galaxies put together, which means that we can see quasars at high redshifts (far distances) and can use them to probe the early universe. But how do we figure out how far away these quasars are in the first place?
Measuring the distance to a quasar isn’t always straightforward
The most reliable way to determine the redshift of a quasar is by measuring the positions of prominent features in its spectrum. However, sometimes we don’t have spectroscopy available for the targets that we want to study. For example, the Vera Rubin Observatory’s Legacy Survey of Space and Time (LSST) is expected to discover millions of new active supermassive black holes, but it won’t be realistic to do spectroscopy on all of them.
The backup plan is to estimate the quasar’s redshift just from its photometry (measurements of the quasar’s brightness through different-colored filters). This type of redshift estimation is called photometric redshift, aka photo-z for short. If we know the brightness of the quasar in many different filters, we can fit templates (known as spectral energy distributions, or SEDs) at a variety of redshifts to this photometry in order to figure out which redshift matches the data best. However, this best-fit solution is often degenerate — meaning that there are several different redshifts that could best match the data — so it can be hard to pick the right one.
Today’s authors test a way to improve photo-z estimates of quasars by tracking their brightness variability during long-term photometric surveys like LSST. Their algorithm is called VAR-PZ: variability-based photometric redshift.
How does VAR-PZ work?
VAR-PZ has three main steps. The first step is to use the standard SED-fitting method of estimating photo-z. The algorithm tries fitting the quasar’s spectrum with a range of SEDs at different redshifts, and calculates the probability of each redshift being the correct one. Then, VAR-PZ uses the best-fit SEDs to calculate the i-band brightness of the quasar at each hypothetical redshift.
This is where the variability of quasars comes into play — quasars might not be little, but they sure do twinkle! A quasar’s light flickers on a timescale of days to years because of changes in the amount of material being pulled into the quasar’s accretion disk. It turns out that this flickering can be described by a Damped Random Walk (DRW) process, which is a model that’s governed by two parameters: the amplitude of the variability (how much the brightness of the quasar changes), and the timescale of the variability (the amount of time it takes for the brightness to return to average).
VAR-PZ’s second step is to calculate these two DRW parameters from the i-band magnitudes it calculated in step one, and it then uses a technique called Maximum Likelihood Estimation (MLE) to estimate the probability of these parameter pairs occurring.
Finally, the probabilities from the SED fitting in the first step are combined with the probabilities of the DRW parameters in the second step to create an overall probability distribution for the redshift of the quasar.
VAR-PZ reduces the number of outlier photo-z measurements
The authors tested VAR-PZ on a sample of over 9,000 quasars from the Sloan Digital Sky Survey (SDSS). These quasars already have redshift measurements from spectra, so they were able to check VAR-PZ’s photo-z estimations against these values. When compared with the traditional method of using SED fitting to calculate photo-z, they found that VAR-PZ decreased the percentage of outlier measurements (cases where the photo-z estimate was wildly different from the true redshift) from 32% to 22%.
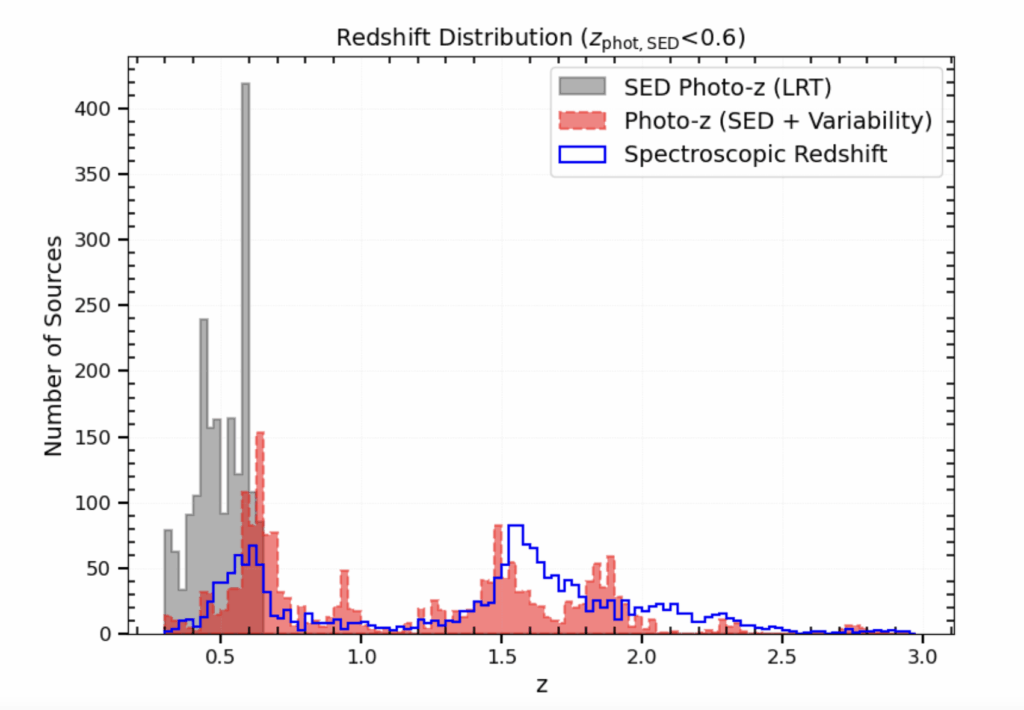
Adding variability analysis was particularly helpful for quasars where SED fitting predicted a photo-z value of < 0.6. Figure 1 shows that VAR-PZ brought the photo-z distribution closer to the true redshift distribution.
VAR-PZ thrives with long-term survey data (like from the future LSST!)
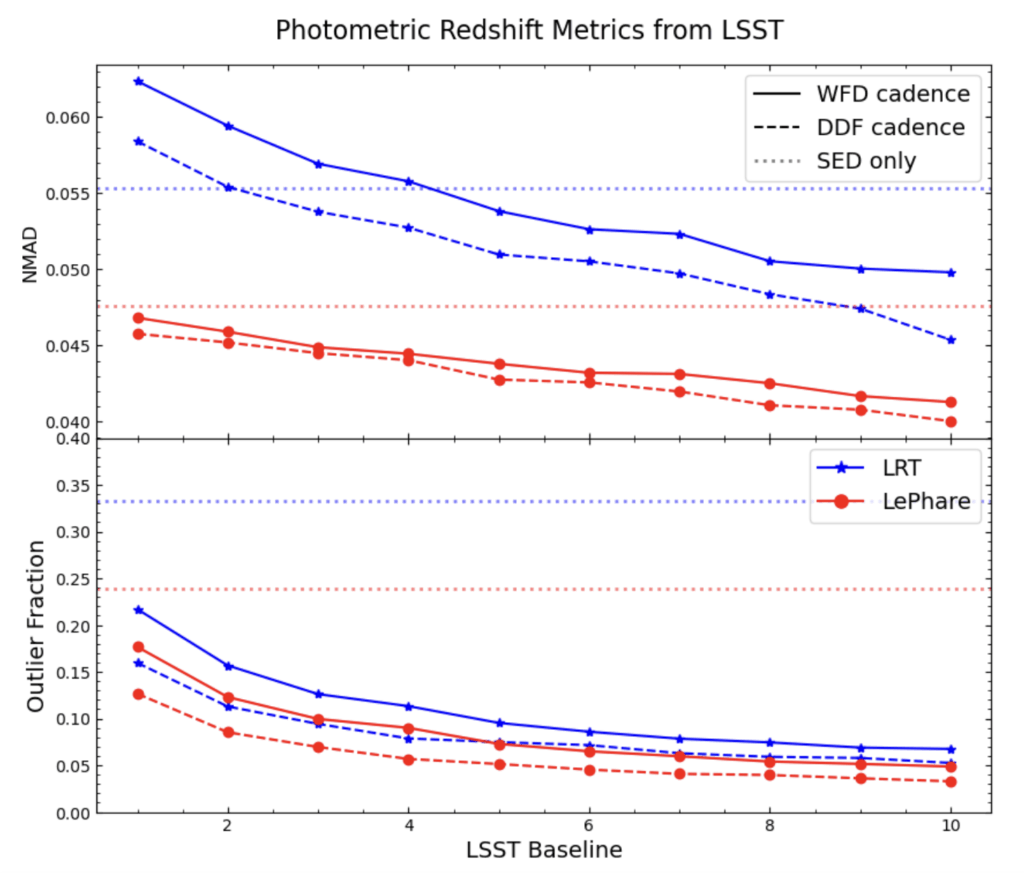
With longer-term measurements of a quasar’s variability, VAR-PZ will become even more precise and accurate. The authors of today’s paper simulated how VAR-PZ would improve over LSST’s 10-year lifetime, and they found that the fraction of outlier measurements would reduce from ~32% to just ~7% by the end of the survey (shown in Figure 2).
Today’s paper shows that VAR-PZ could be a useful way to improve distance estimations of quasars observed by LSST (and other long-term surveys) without having to do expensive follow-up spectroscopy. It’ll be a while before we see those results, though! LSST isn’t scheduled to begin its 10-year survey for another few months.
Astrobite edited by Lindsey Gordon
Featured image credit: NASA, ESA, CSA, Joseph Olmsted (STScI); Canva Pro