Title: First images of the Antares photosphere from spectropolarimetry
Authors: Q. Pilate, E. Josselin, A. Lèbre, A. López Ariste, Ph. Mathias, and A. Lavail
First Author’s Institution: Institut de Recherche en Astrophysique et Planétologie, Université de Toulouse, UPS, CNRS, IRAP/UMR 5277, 14 avenue Edouard Belin, 31400 Toulouse, France
Status: Published in Astronomy & Astrophysics [open access]
It can be tempting to think of stars as featureless balls of light in the night sky, but the truth is anything but. Turning our telescopes to our nearest stellar neighbour, the Sun, reveals that there is an almost constant party of light and matter on the stellar surface. Though stars are so hot that all of their material is in an energetic plasma state, they still have a ‘surface’ in a sense; a star’s surface is the point at which light no longer meaningfully interacts with the stellar material, so it can readily escape and travel across the Universe to meet our eyes.
We can’t send probes to the Sun’s surface, yet there is plenty of reason to use our telescopes to study the face of our star and those elsewhere in the Galaxy. Sunspots – magnetically complex regions of cool material on the Sun’s surface – were first observed by Kepler in 1607, and were later used to infer the rotation of the Sun, cementing it as a celestial body. We now understand that these solar surface features are important to predict geomagnetic storms and Earth’s aurorae. In other stars, surface features can be indicative of deeper stellar structure as well as the internal chemistry of the star as material is dredged up to the surface through convection.
Our Sun’s surface is routinely imaged with high-resolution telescopes, but this is only possible because it’s close to us; even the next closest star to us is too small in the sky to have its surface resolved with our most powerful telescopes. Thankfully, there are a few ways that astronomers have thought to work around this fundamental problem. One such approach is called interferometry, where the data from multiple telescopes spaced far apart are processed together to simulate a larger telescope; this method has been used to image the surface of the red supergiants Betelgeuse and Antares in the infrared. Interferometry is not the only way to learn about the surface of a distant star, though, and today’s authors instead use the polarisation of the starlight itself.
Light is an electromagnetic wave in which the electric and magnetic fields oscillate in directions perpendicular to that in which it travels. If lots of light packets are moving together with the electric fields all oscillating in random directions, we call this unpolarised light since the polarisation signal is smeared out; in contrast, if the bulk flow of photons oscillates in a common direction, we say that this light is polarised. For perfectly smooth stars, i.e. with nothing much happening on their surface, starlight should be approximately unpolarised. However, when today’s authors look at the polarisation spectrum of a few spectral lines of Antares’ starlight (Figure 1) they find that they have a non-zero polarisation! That is to say that there must be something going on on the stellar surface…
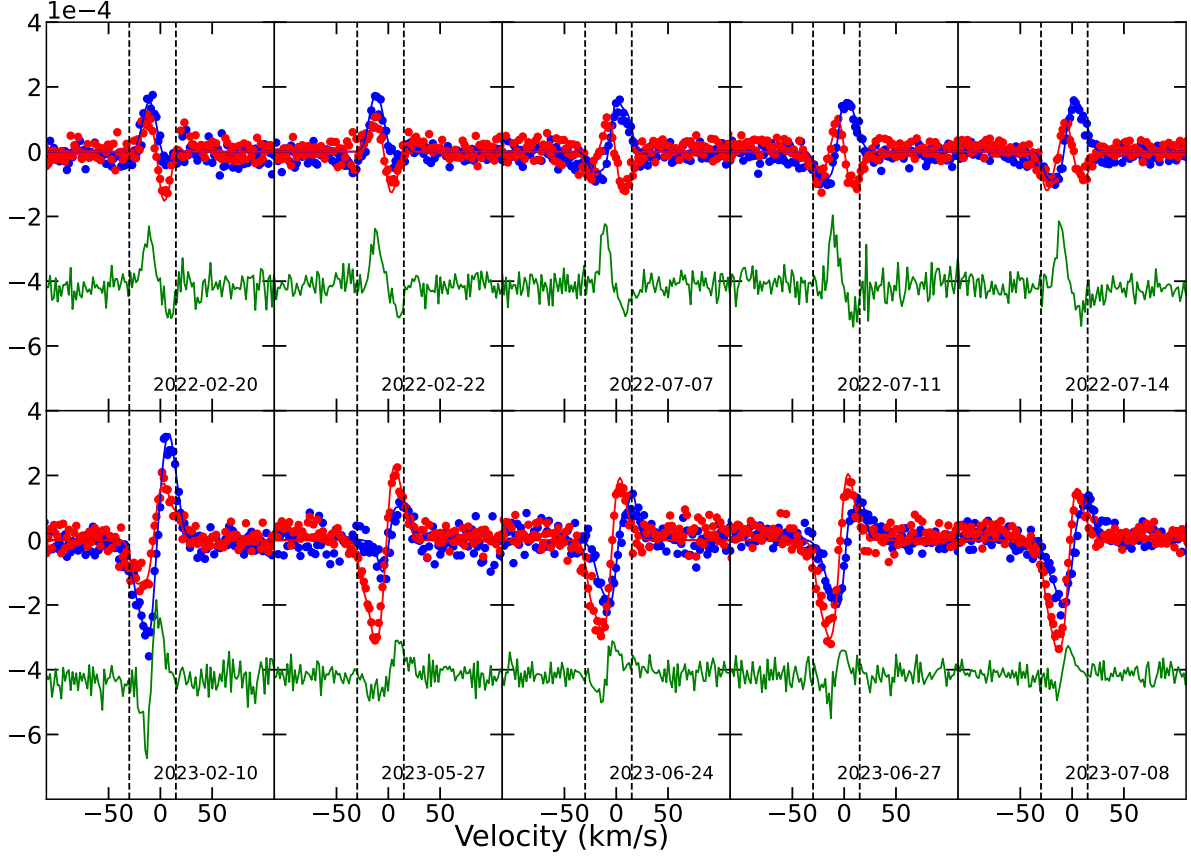
Figure 1: Each panel shows the polarisation signal within a spectral line as a function of radial velocity at a different date. This lets the authors attribute surface features to different locations on the projected stellar disc. The blue and red dots correspond to different components of the polarization in different geometric axes and the green line represents the circular polarisation signal (which is when the electric field of the photons appears to rotate as the light propagates), shifted down and amplified. The blue and red lines are the model fits to the data given the images shown in Figure 2. Source: Fig. 4 in today’s paper.
Antares is a red supergiant star, and astronomers know from stellar models and previous direct observations that red supergiants have large scale convection in their outer layers. This means that there are huge pockets of hot, bright material that bubble to the surface, while cooler and darker material sinks down to the stellar interior. The authors suggest that these convective cells are responsible for the polarisation signature in Antares’ starlight since their distribution would ‘mess up’ an otherwise smooth and even stellar disc, making the temperature vary across the surface. Further, these convective cells rise to the surface with a certain velocity, and so where they are on the stellar surface encodes the resultant radial velocity that we then observe as a wavelength shift in the spectral line. As a result, the polarisation spectrum encodes both the location and brightness of these surface convective cell ‘hot spots’.
With the data in hand, the authors just need a model of the stellar surface to compare it to. The simplest, physically motivated way to model the surface of a star is with spherical harmonics, where the authors use up to 5th degree harmonics in this study. For each observation from February 2022 up to July 2023, the authors simulate the polarisation signal of the given spherical harmonic surface map and fit that to the observations. The best-fit surface maps are shown in Figure 2, where we can see large bubbles of material slowly changing over time just as we’d expect from such a large red supergiant!
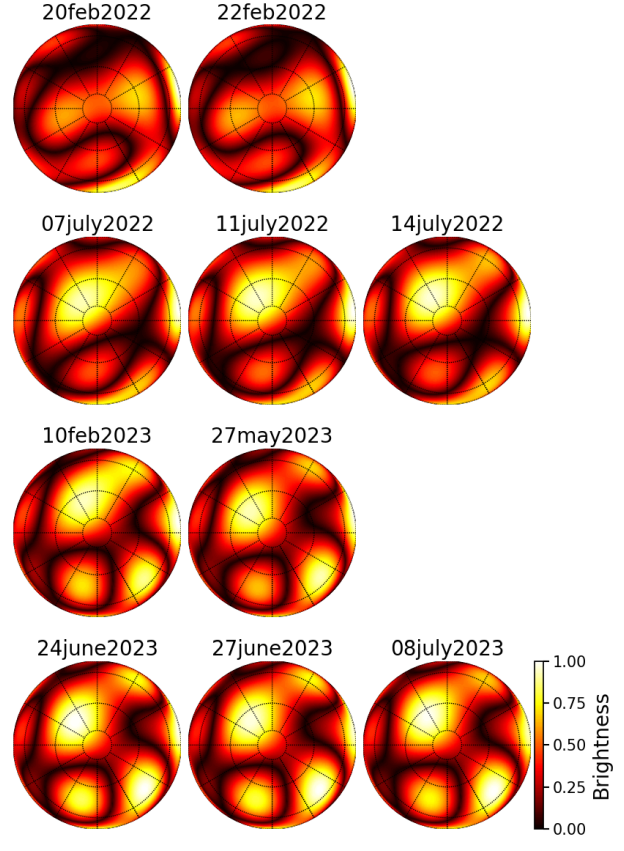
Figure 2: The best-fit surface maps of Antares from all observation epochs show huge bubbles of material on the stellar surface. Source: Fig. 5 in today’s paper.
While the above surface maps are not direct images of the surface, they can still tell astronomers a lot about the surface dynamics and properties of Antares. Using the polarisation spectrum of starlight – or in other words, spectropolarimetry – to map a star needs only one telescope (unlike interferometry) and can, in principle, be used for stars further away than we can directly image. For now, today’s authors have shown that the surfaces of red supergiant stars right on their deathbed are anything but simple or static.
Astrobite edited by Abbe Whitford
Featured image credit: Judy Schmidt, NASA/JPL, Pilate et al