Title: Exploring blazars through sonification. Visual and auditory insights into multifrequency variability
Authors: Gustavo Magallanes-Guijón, Sergio Mendoza
First Author’s Institution: Instituto de Astronomía, Universidad Nacional Autónoma de México
Status: Published in RAS Techniques & Instruments. [open access]
Prelude
Astronomers are used to making awe-inspiring pictures of the sky, but did you know they can also use blazars to make some pretty groovy music? Blazars, a type of galaxy with a supermassive black hole at its centre and jets, one of which is pointed almost directly at us, are the topic of today’s paper. They are known to flare (get brighter) on both random and quasi-periodic timescales across the electromagnetic spectrum. In fact, if we measure the flux (how bright they are) at different wavelengths over time, we can model how particles are accelerated in the jets and can figure out how the electromagnetic radiation that we see is made. These plots of flux against time are called light curves. Today’s authors made multiwavelength light curves similar to the one in Figure 1 to look at how 9 blazars changed in brightness over time using data taken with radio, optical, X-ray and gamma-ray telescopes. To keep things simple, we are going to focus on just one of these: BL Lacertae.
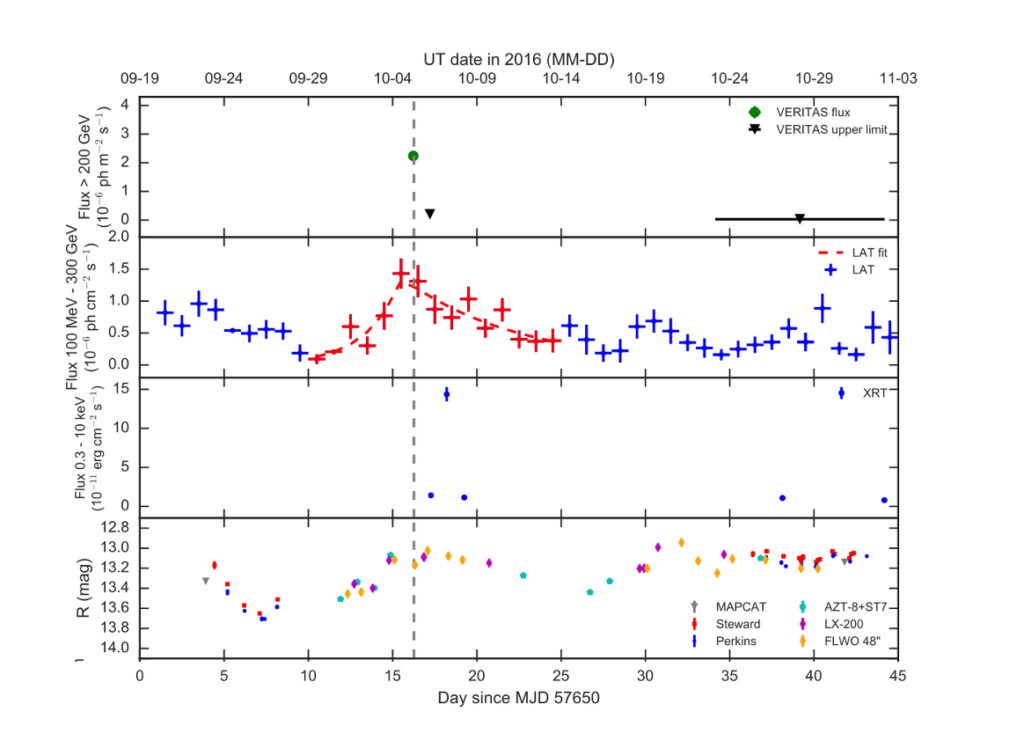
Figure 1: Example multi-wavelength lightcurve of blazar BL Lacertae. Different panels show the flux of BL Lacertae in different bands. From top to bottom, panels are very-high-energy gamma-rays from VERITAS, high-energy gamma-rays from Fermi-LAT, X-rays from Swift-XRT and R-band optical data from a variety of telescopes. Note that the different wavelength bands use different units, and the optical band is measured in magnitudes which means smaller numbers imply brighter. Source: Adapted from Figure 5 in Abeysekara et al. 2018.
From Light curves to a Supermassive Symphony
As well as making light curves, today’s authors use a complementary method called sonification. In short, they used a systematic and reproducible method to transform scientific data into sound. While you may not have heard of sonification before, you may be aware of Geiger counters which sonify ionising radiation to create an audible signal. To sonify the blazar light curve data, they first collected light curve data from radio, optical, X-ray and gamma-ray telescopes. Next, they applied pre-processing steps to remove any anomalous data and to format the data in a way they could use. Then, they binned the data by brightness into 7 bins and assigned each bin a note in a musical scale. They also made the higher notes (corresponding to a larger flux) louder than the lower notes (corresponding to a smaller flux), making it easier to hear subtle changes and patterns.
The blazar song is played at 80 notes per minute, with each beat corresponding to a flux point. The notes from each wavelength band were played at a different octave. They used a synthesiser to make the music, selecting a bell as the instrument. This was chosen as it has a well-defined starting point and then an exponential decay, making it easier to hear small changes. It also has overtones, which help the human ear detect small changes.
Finally, the authors turned these sonified audio signals back into two different visual representations. Firstly, they made waveforms which show the amplitude (loudness) over time. Secondly, they made spectrograms which show the prevalence of different pitches as a heat map, which can be helpful for picking out different patterns. You can see the results for BL Lacertae in Figure 2, or you can listen to the results here.
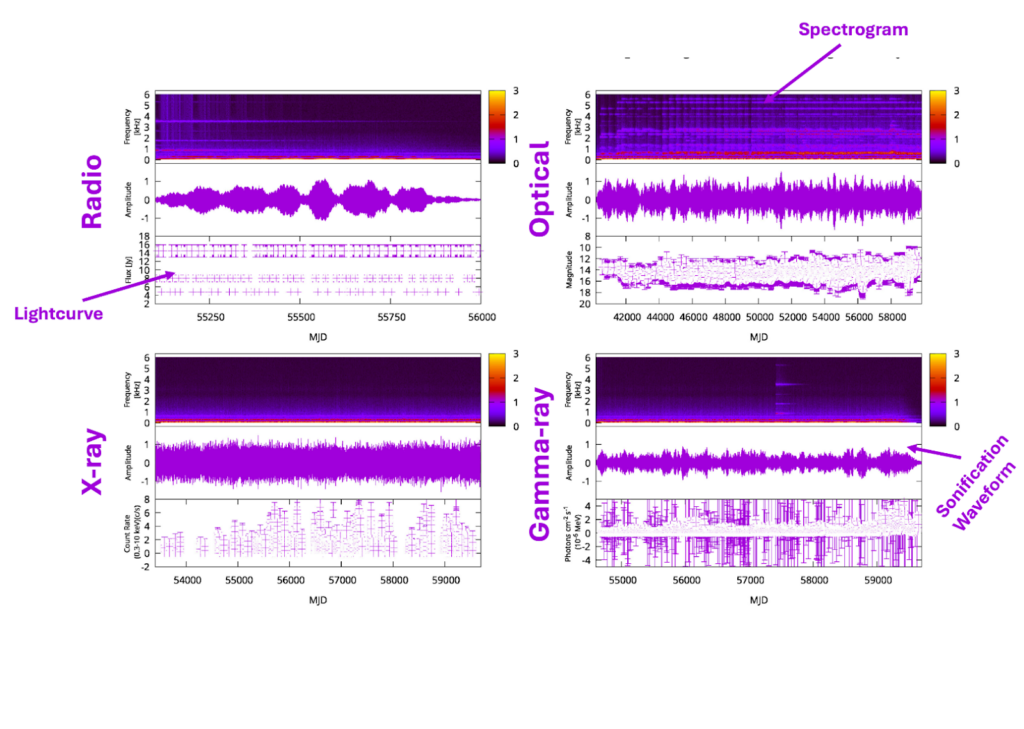
Figure 2: BL Lacertae results (adapted from Figure 3 in the paper). Each of the four subfigures represents observations at a different wavelength. Within each subfigure, the bottom panel is the light curve, the middle panel is the waveform of the sonification and the top panel is the spectrogram.
Finalé
The authors concluded that sonifying scientific data has advantages for everyone!
- Sonification helps you identify patterns you might otherwise miss. The authors highlighted previous work showing that humans are better at detecting patterns aurally than visually.
- Visual graphs can be insufficient for multidimensional datasets. For example, multiwavelength light curves can be challenging to represent in a helpful way on paper.
- Finally, and most importantly, by sonifying your data, you are blazing a trail for blazar (and other research) accessibility. Graphical representations can pose a challenge to individuals who are blind or visually impaired, both those who work in science and those who would like to hear about this science. This paper highlights a clear way we can make research more accessible to everyone.
So, why not give it a go? Have a listen to all the blazars in this paper here, and drop your favourite track in the comments!
Astrobite edited by: Chris Layden
Featured image credit: Adapted from “Andromeda Galaxy – Astrophotography.” by Edoardo Dusina, licensed under CC BY 4.0