This guest post was written by Aylin Garcia Soto, a graduating Ph.D. student from Dartmouth University studying M dwarf variability. She will start a postdoc at Boise State University working with Dr. Brian Jackson on tidal decay in exostellar systems. Outside of research, she enjoys reading, watching K dramas (and other dramas), playing guitar, and writing creative stories.
Authors: Emmanuel Durodola, Fabio Pacucci, Ryan C. Hickox
First Author’s Institution: Department of Physics & Astronomy, Dartmouth College, Hanover, NH 03755, USA
Status: Published in ApJ [open access]
The Little Red Dot
Once upon a time there was an object called Little Red Dot. It lived a long long long (over 12 billion years) ago with a big big big (x10) ol’ black hole wrapped in a large dusty blanket. One day, a gentle-telescope named JWST took its camera to visit its universe, and on its way, it bumped into Little Red.
Oh my, what a red, old, compact galaxy you are. All the better to confuse you with, my dear scientist.
What strange spectral energy distribution you present. All the better to keep you guessing (what I am).
The Little Red Dots and Modern AGNs
Much of what we know about Little Red Dots (LRDs) arose after 2024 thanks to data from the JWST space telescope. These red objects represent emitted light from high-redshift or distant objects that formed about 1.5 billion years after the big-bang (13.8 billion years ago). To measure the energy or brightness of these objects at different frequencies or wavelengths, we create a graph called spectral energy distributions (SED). LRD SEDs show the presence of both old stellar populations and active galactic nuclei (AGNs). These AGNs are different from what we see in our local universe. And until recently, distant AGN didn’t show an X-ray counterpart signal unlike modern, local, active galactic nuclei. However, these AGN with X-ray counterparts may tell us of how LRDs may transition into modern AGNs.
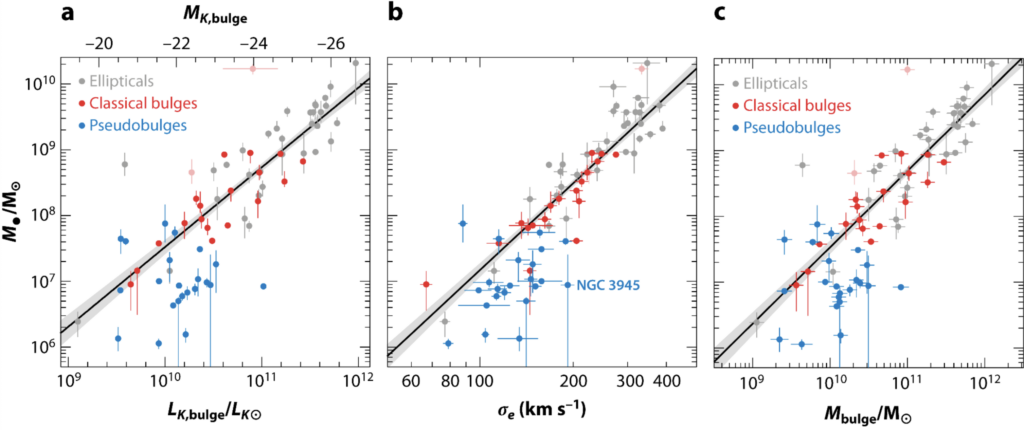
Studies of local galaxies and AGNs suggest that all large galaxies contain a supermassive black hole (SMBH) in their center. The SMBH at the center of each large galaxy are a million to a billion times more massive than our sun, and how they form and evolve are unclear. Figure 1 shows the relationship between the estimated mass of the center black hole () in units of the mass of the sun (e.g. 1 = 1.9891 × 1030 kilograms) and its host galaxy, and the the luminosity of the stars concentrated at the center of the galaxy in units of the luminosity of the sun (; left), the random velocity of stars in the galaxy given the influence of some mass (; center), and the mass of the stars at the center bulge of the galaxy (; right). We can see that all of these relationships are linearly correlated suggesting that black holes and their host galaxies may actually evolve together! However, LRDs show different relations, they are more massive by a factor of 10-100. In today’s paper, the authors look at the SEDs of LRDs to explore the relationships between LDRs and their host galaxies as a way to analyze the origin of their SEDs, to see if most of the contribution comes from an AGN or a stellar population. These objects are important in understanding what makes a black hole grow so massive!
The Little Red Dots and Overmassive AGNs
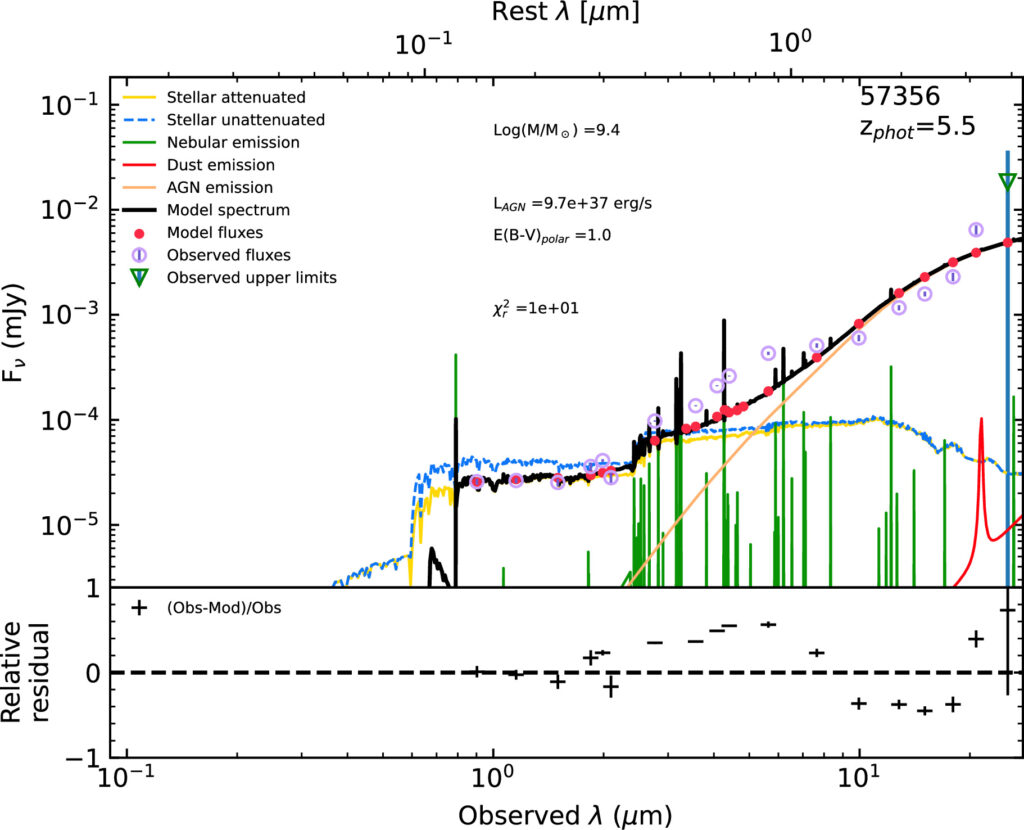
To analyze the LDRs, the authors built an SED model (Figure 2) by simulating how a galaxy would look through the JWST camera filters. By comparing simulated observations to the actual JWST data, the SED can find the best match and estimate galaxy properties like stellar mass and dust levels. In broader terms, an SED takes theoretical spectral models to fit light signals and this allows us to predict what a galaxy could like. This specific model combines the light from three different main ingredients in the galaxy: the star, the surrounding gas, and the dust donut that encompasses AGN. Even though the AGN can sometimes be brighter than the galaxy component, it is still important to incorporate those non-AGN components into the model. The model uses different data-calibrated modules for each component. For instance, for the star component the model uses the history of how the stars formed in the galaxy (stellar formation history), while the dust component is measuring how much the galaxy absorbs a well-known wavelength of light called the Lyman-alpha line, which is found throughout the space between stars. This line can be found in the interstellar medium or the matter between our solar system and others.
The authors find that LRDs are consistent with hosting AGNs with a mass around a million to around 57 million times the mass of the sun. These AGNs make up most of the mass in compact/small galaxies, leaving a limited amount of mass left over for stars and other objects. They also find that the distant AGNs contribute about 20% of the observed light of each galaxy. This is a similar relationship to what we find with local AGNs as represented in Figure 1! The authors find that LRD with SEDs that are mostly dominated by the AGN (20-40%) have a mass that is 10 times bigger than an average local AGN, while LRDs with larger AGN SED contribution (>40%) are more massive by a factor of 100. In other words, if what makes up most of the light of the LRDs is the AGN, then we are dealing with overmassive AGNs.
The authors also showed that mid-infrared data is important when fitting LRDs. As we can see in Figure 2, the AGN contribution to an LRD spectrum doesn’t come into play until longer wavelengths.This is because the dust (which the AGN is surrounded by) emits at longer wavelengths. If we don’t have observations at these wavelengths for our LDRs, the best fit models will likely not include an AGN contribution. In a previous study, the authors had a small amount of data using JWST’s Mid-Infrared Instrument (MIRI) which allows us to observe the LRDs at these longer wavelengths. In today’s paper the authors showed that when they used the MIRI data at longer wavelengths, their models favor adding AGN components to the best fit model.
The Little Red Dots and The X-ray Problem
Several studies have cross-referenced LRDs with X-ray data but have rarely found any examples of an LRD with X-ray signal. One theory is that infrared data possibly overestimates the brightness of the LRDs’ AGN and given the relationship shown in Figure 1. This would mean that the true masses of the black holes at the center of these galaxies should be smaller. This overestimation could occur because the dust is thicker than we predict or that the inflow of black hole food is at an influx. Another theory for lack of X-ray signal is that the AGN is surrounded by a dense gas rather than dust. This would allow suppression of X-ray because it cannot escape the dense gas.
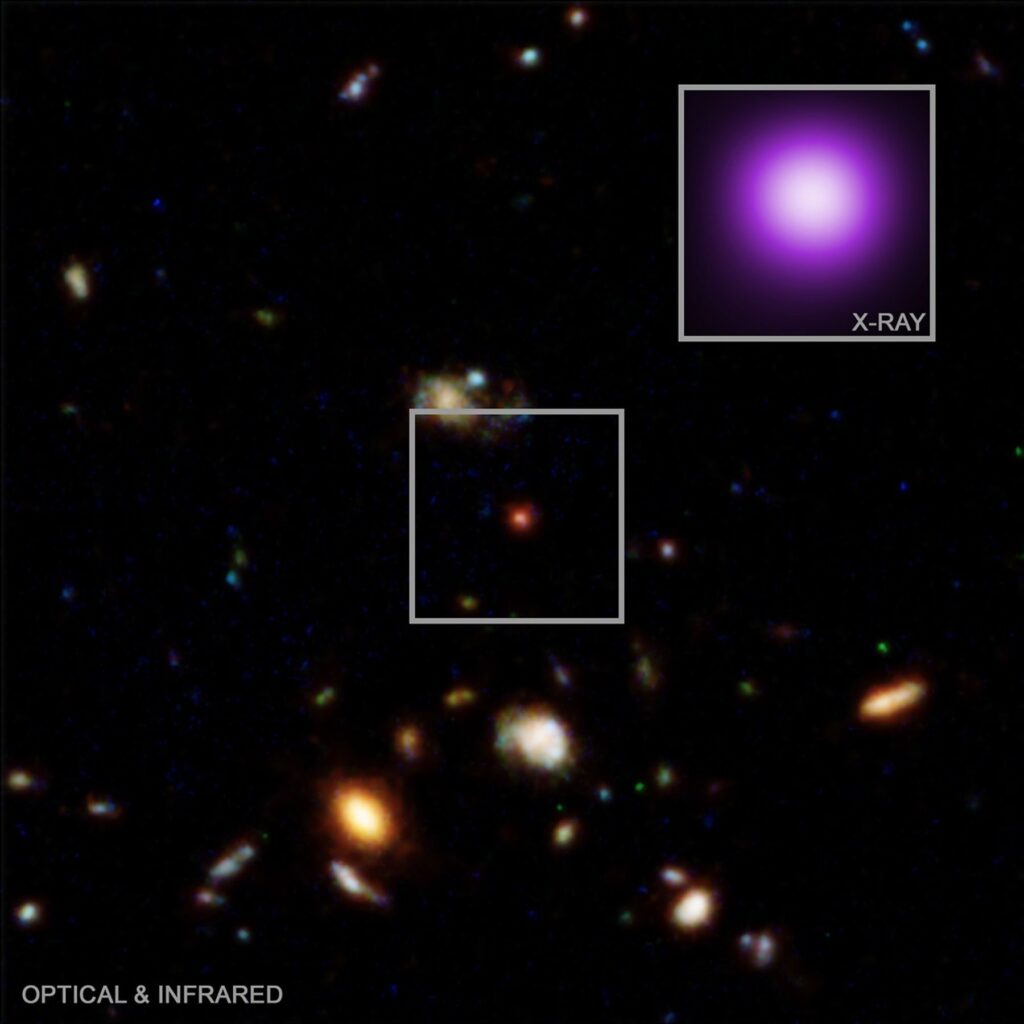
However, one study was able to find an X-ray counterpart using the NASA Chandra X-ray telescope for 3DHST-AEGIS-12014 (Figure 3). It is worth noting that this LRD is closer to us than most other LRDs we observe. The only difference between this LRD and others we observe is the X-ray component, so we think that this LRD is actually a transitional object between the high-redshift LRDs we usually observe and local AGNs.
While there is still a lot to learn about LRDs and their relationships to AGN, today’s paper helps us better understand that these distant objects are likely to have an overmassive AGN (by today’s standard) surrounded by a dust donut and that their lack of X-ray companion at this stage in their evolution could be due to either an incorrect assumption of their brightness or that the donut of stuff surrounding the AGN is not dust but, more likely, dense gas. This paper brings us one step closer to fully understanding AGN evolution, or perhaps, it’s just ‘all the better to confuse you with, my dear scientist.’
This guest post is part of Astrobites coverage of #BlackSpaceWeek presented by Black in Astro. Black in Astro is a grassroots organization that offers support and networking for Black people working in or studying astronomy and space-related fields across the globe. Black Space Week is a virtual conference that features panels, talks, art, giveaways, and various other virtual events to celebrate Blackness in astronomy and space science. For more information on Black Space Week and Black in Astro, please visit their website: https://www.blackinastro.com/.
Astrobite edited by Erica Sawczynec
Featured image credit: NASA/CXC/SAO/M. Weiss; adapted by K. Arcand & J. Major